Energy level diagrams of the elements
Pick an element to open its interactive Grotrian diagram: every drawn transition carries its vacuum wavelength and reduced dipole matrix element, and pointing at a line isolates it and shows frequency, Einstein coefficient and source.
- Alkali metal
- Alkaline earth
- Transition metal
- Post-transition metal
- Noble gas
- Lanthanide
- Actinide
- Measured lifetimes, hyperfine data and isotope shifts included
Atoms with measured data
For the atoms that cold-atom, optical-tweezer, optical-clock and ion-trap experiments work with, each isotope has its own page. Beyond the NIST level energies these include measured lifetimes, transition rates, hyperfine constants and isotope shifts, each with its citation; calculated values are tagged as such.
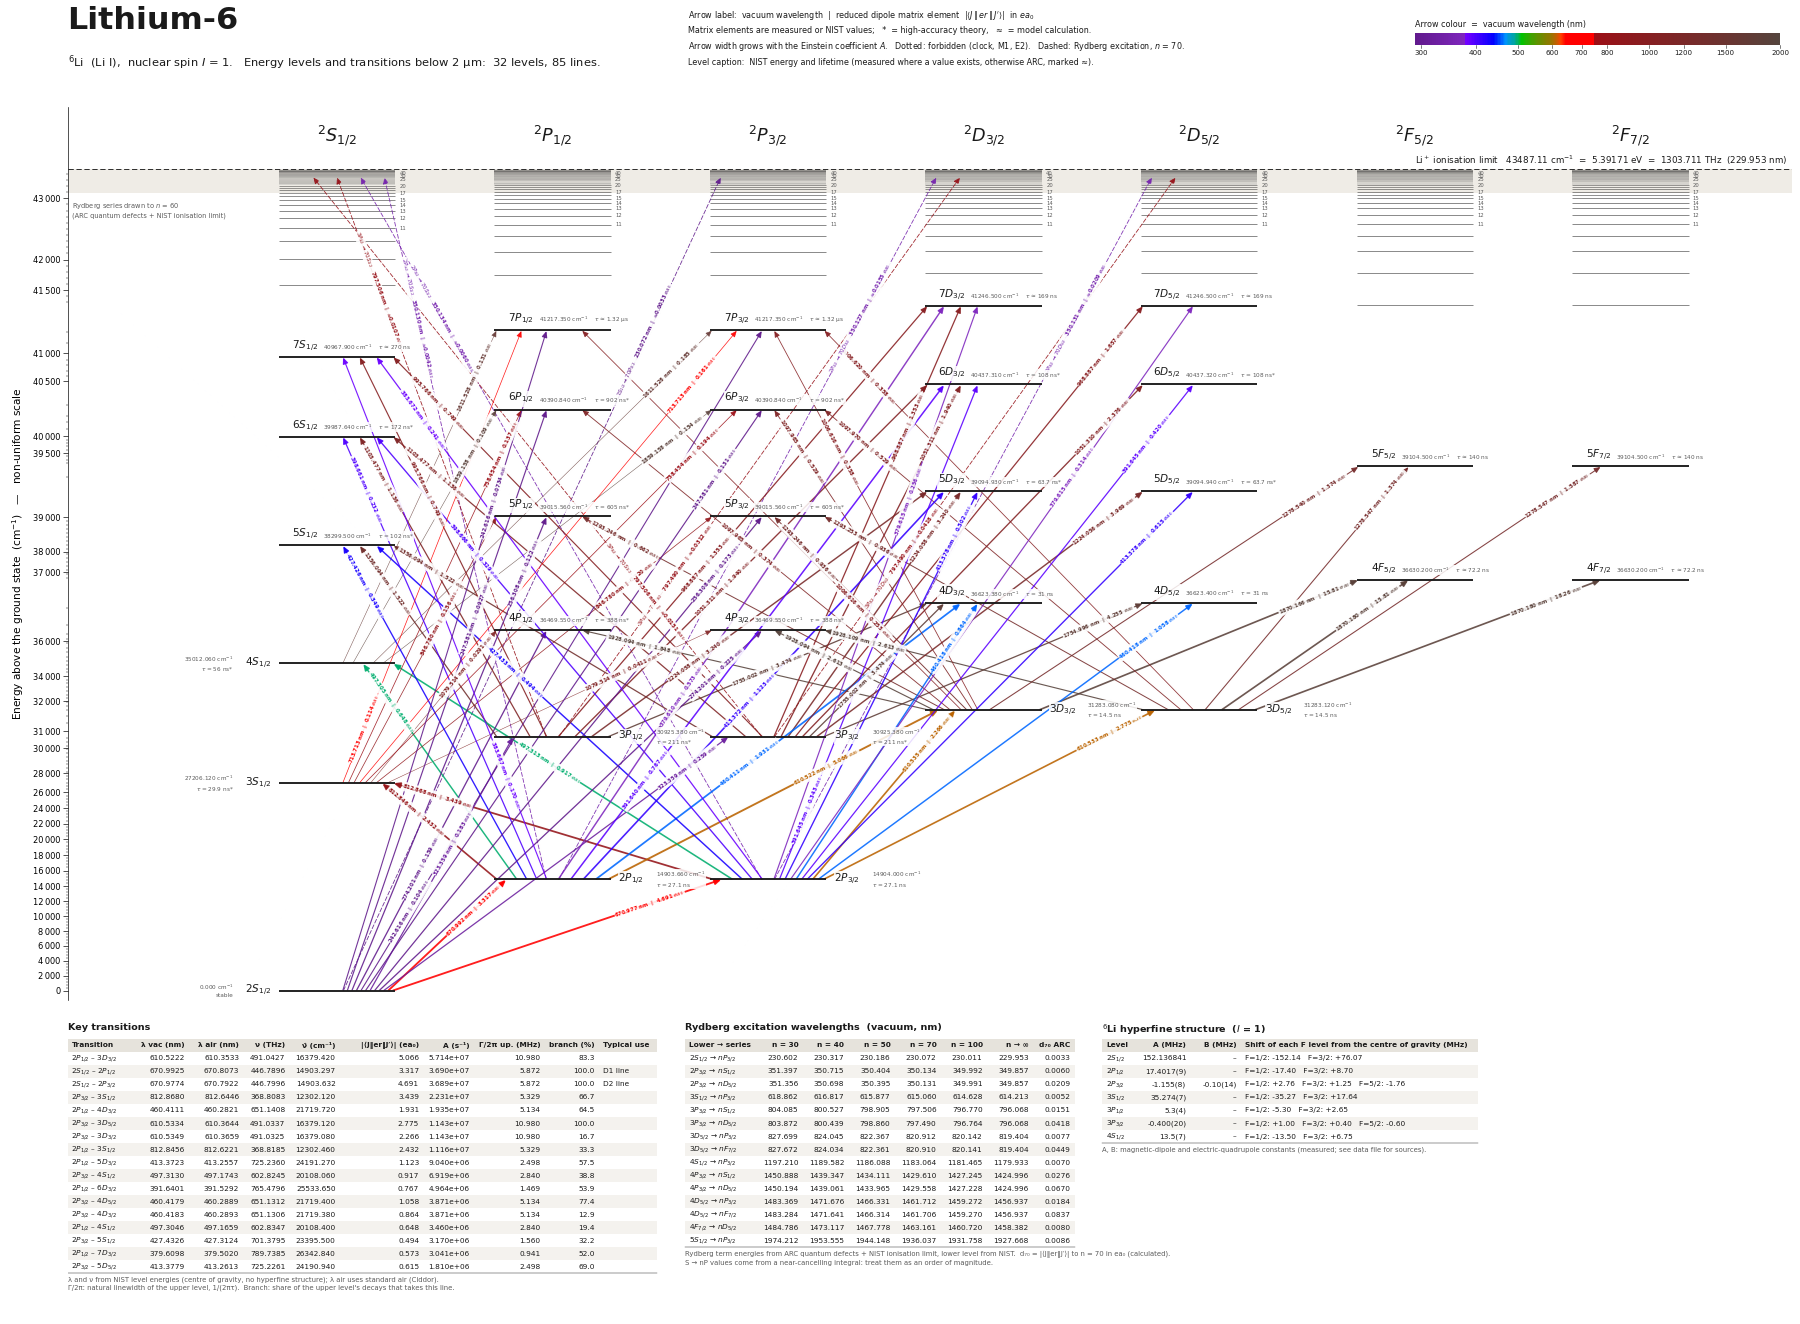 Lithium-6 (6Li)32 levels, 85 transitions below 2 µm
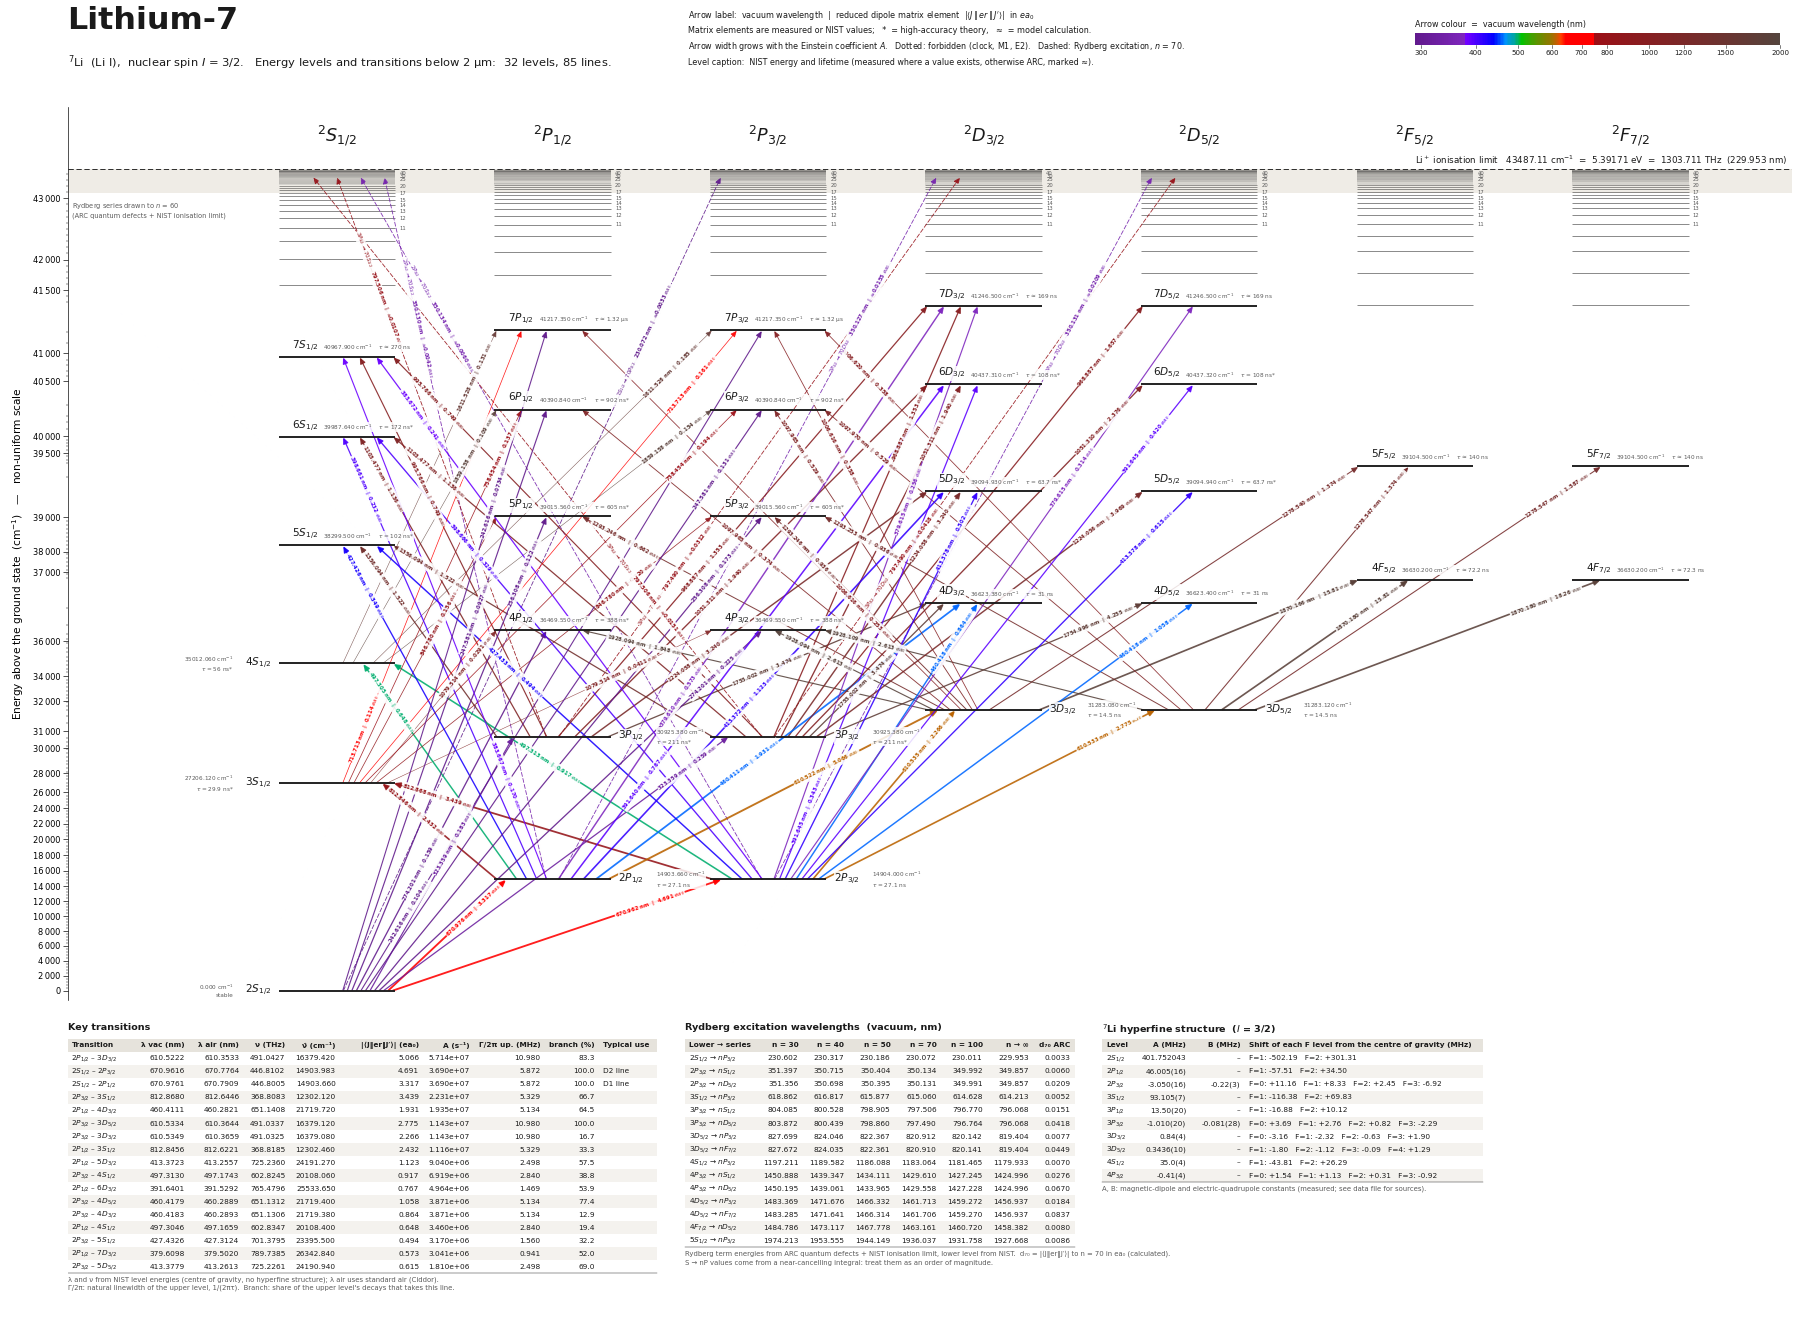 Lithium-7 (7Li)32 levels, 85 transitions below 2 µm
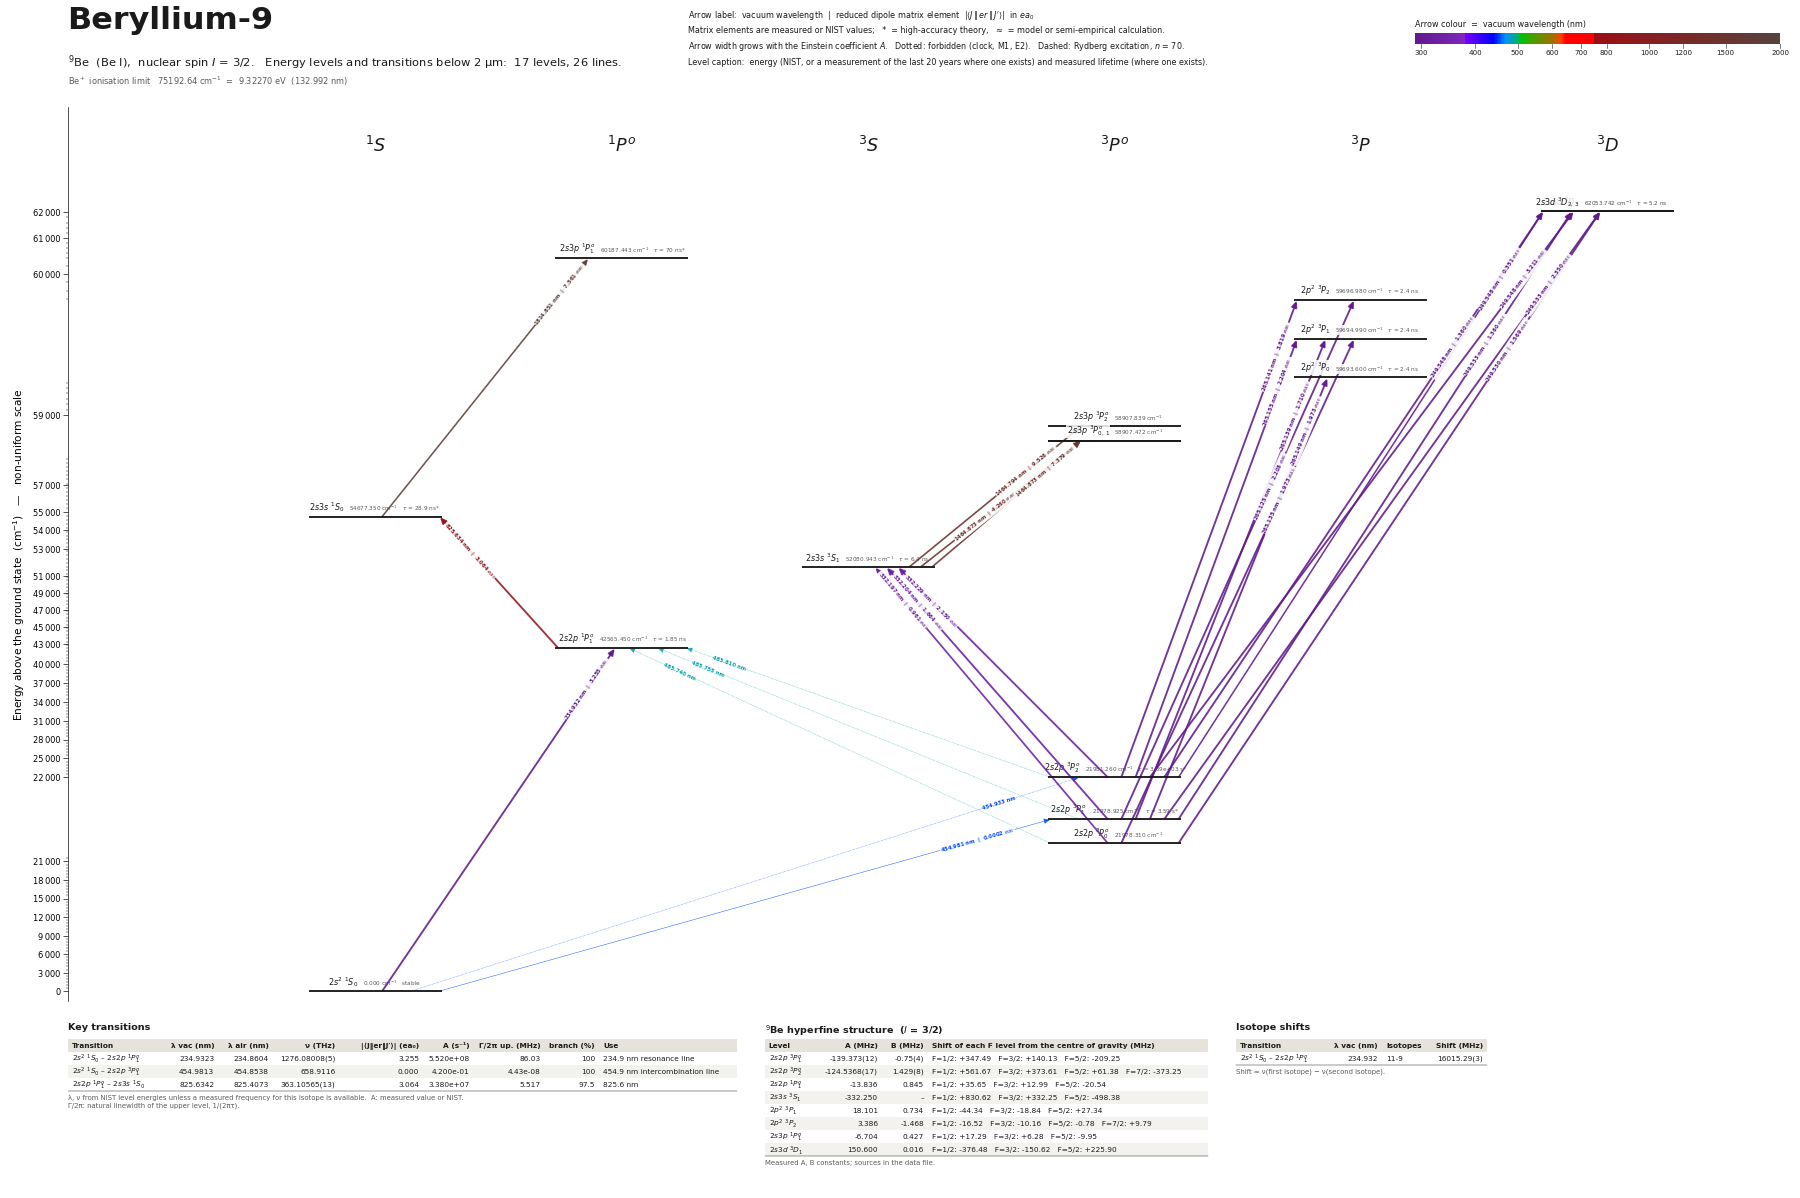 Beryllium-9 (9Be)17 levels, 26 transitions below 2 µm
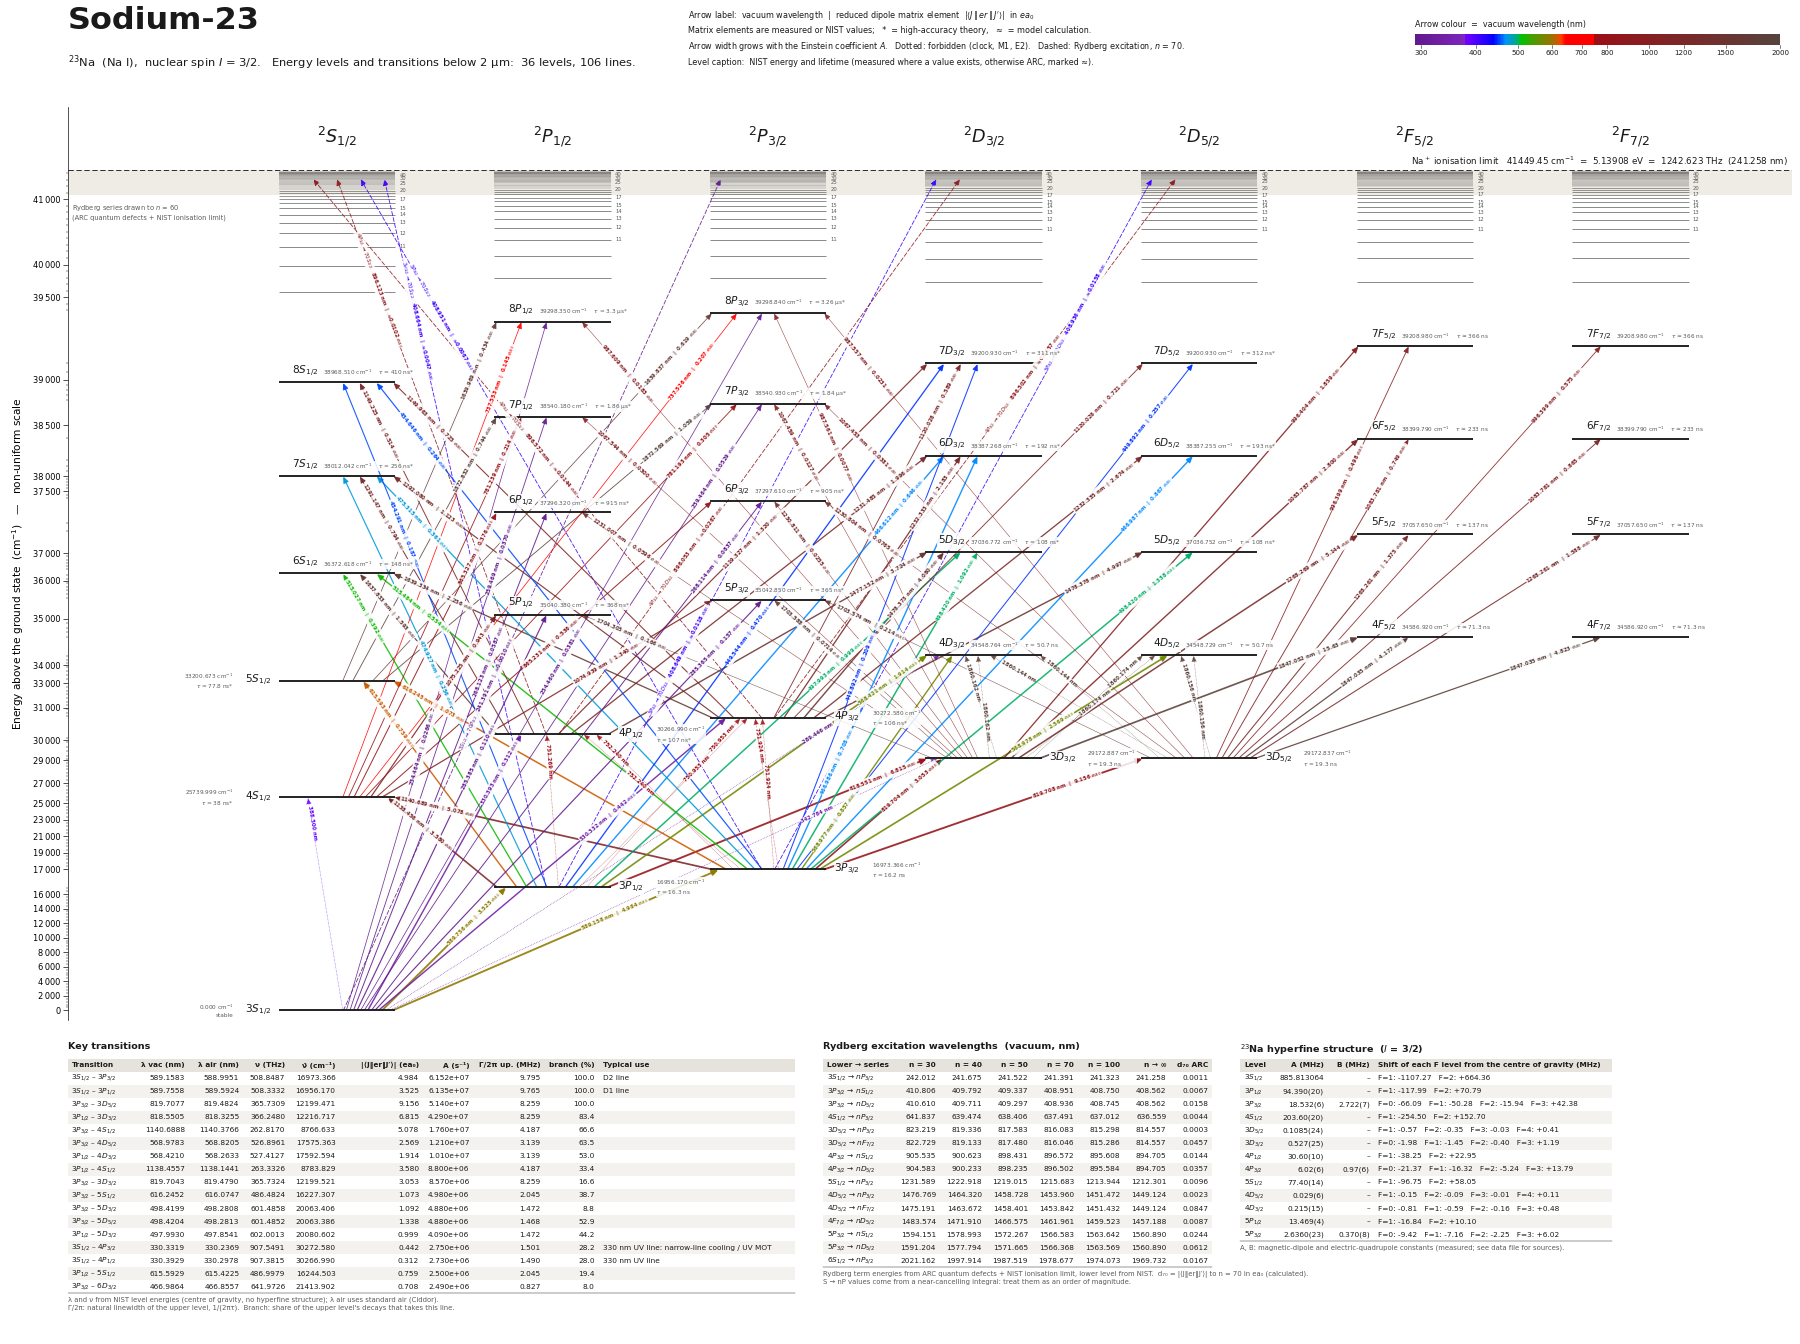 Sodium-23 (23Na)36 levels, 106 transitions below 2 µm
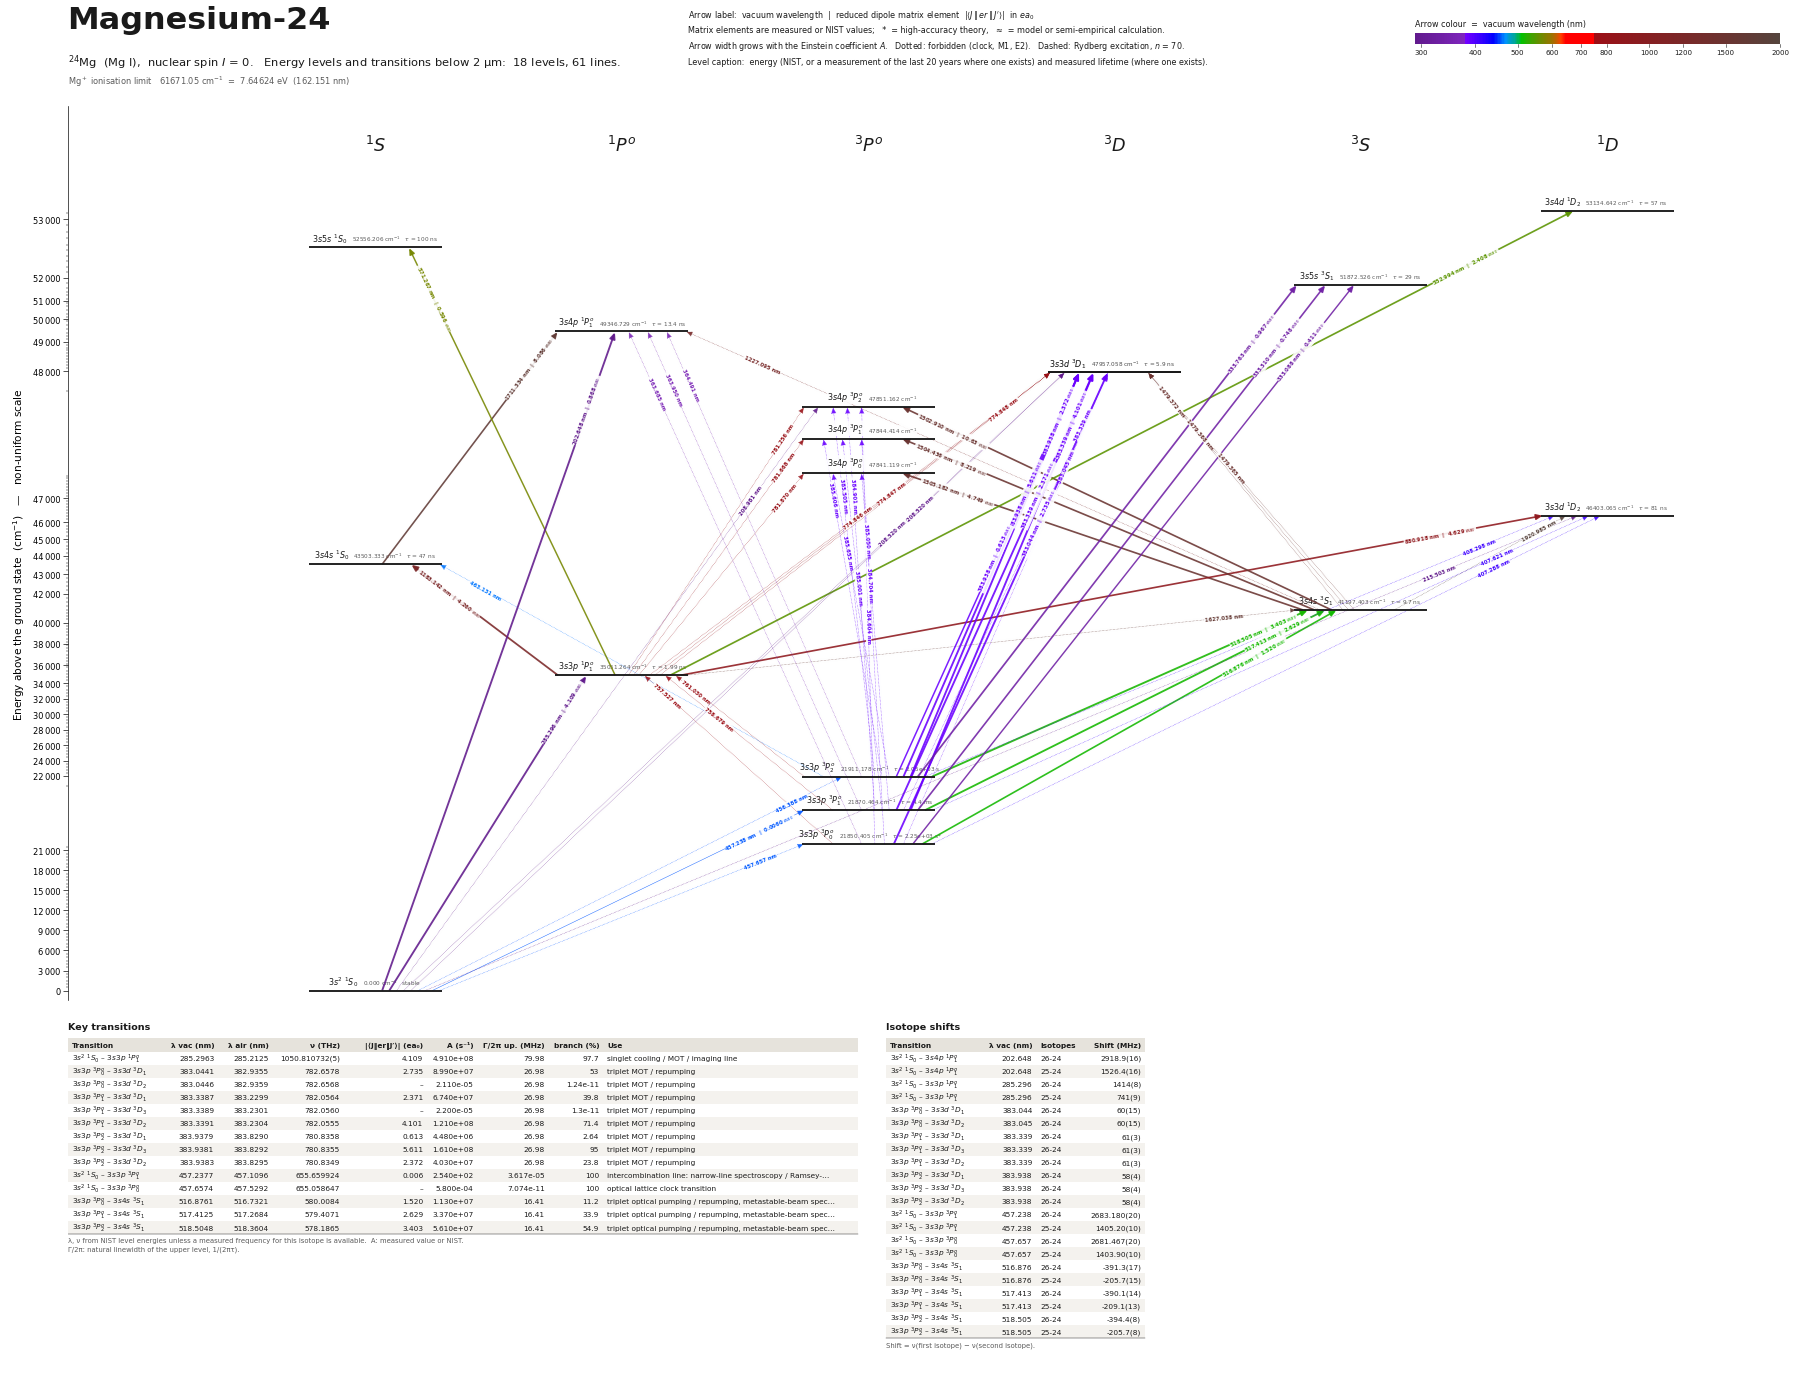 Magnesium-24 (24Mg)18 levels, 61 transitions below 2 µm
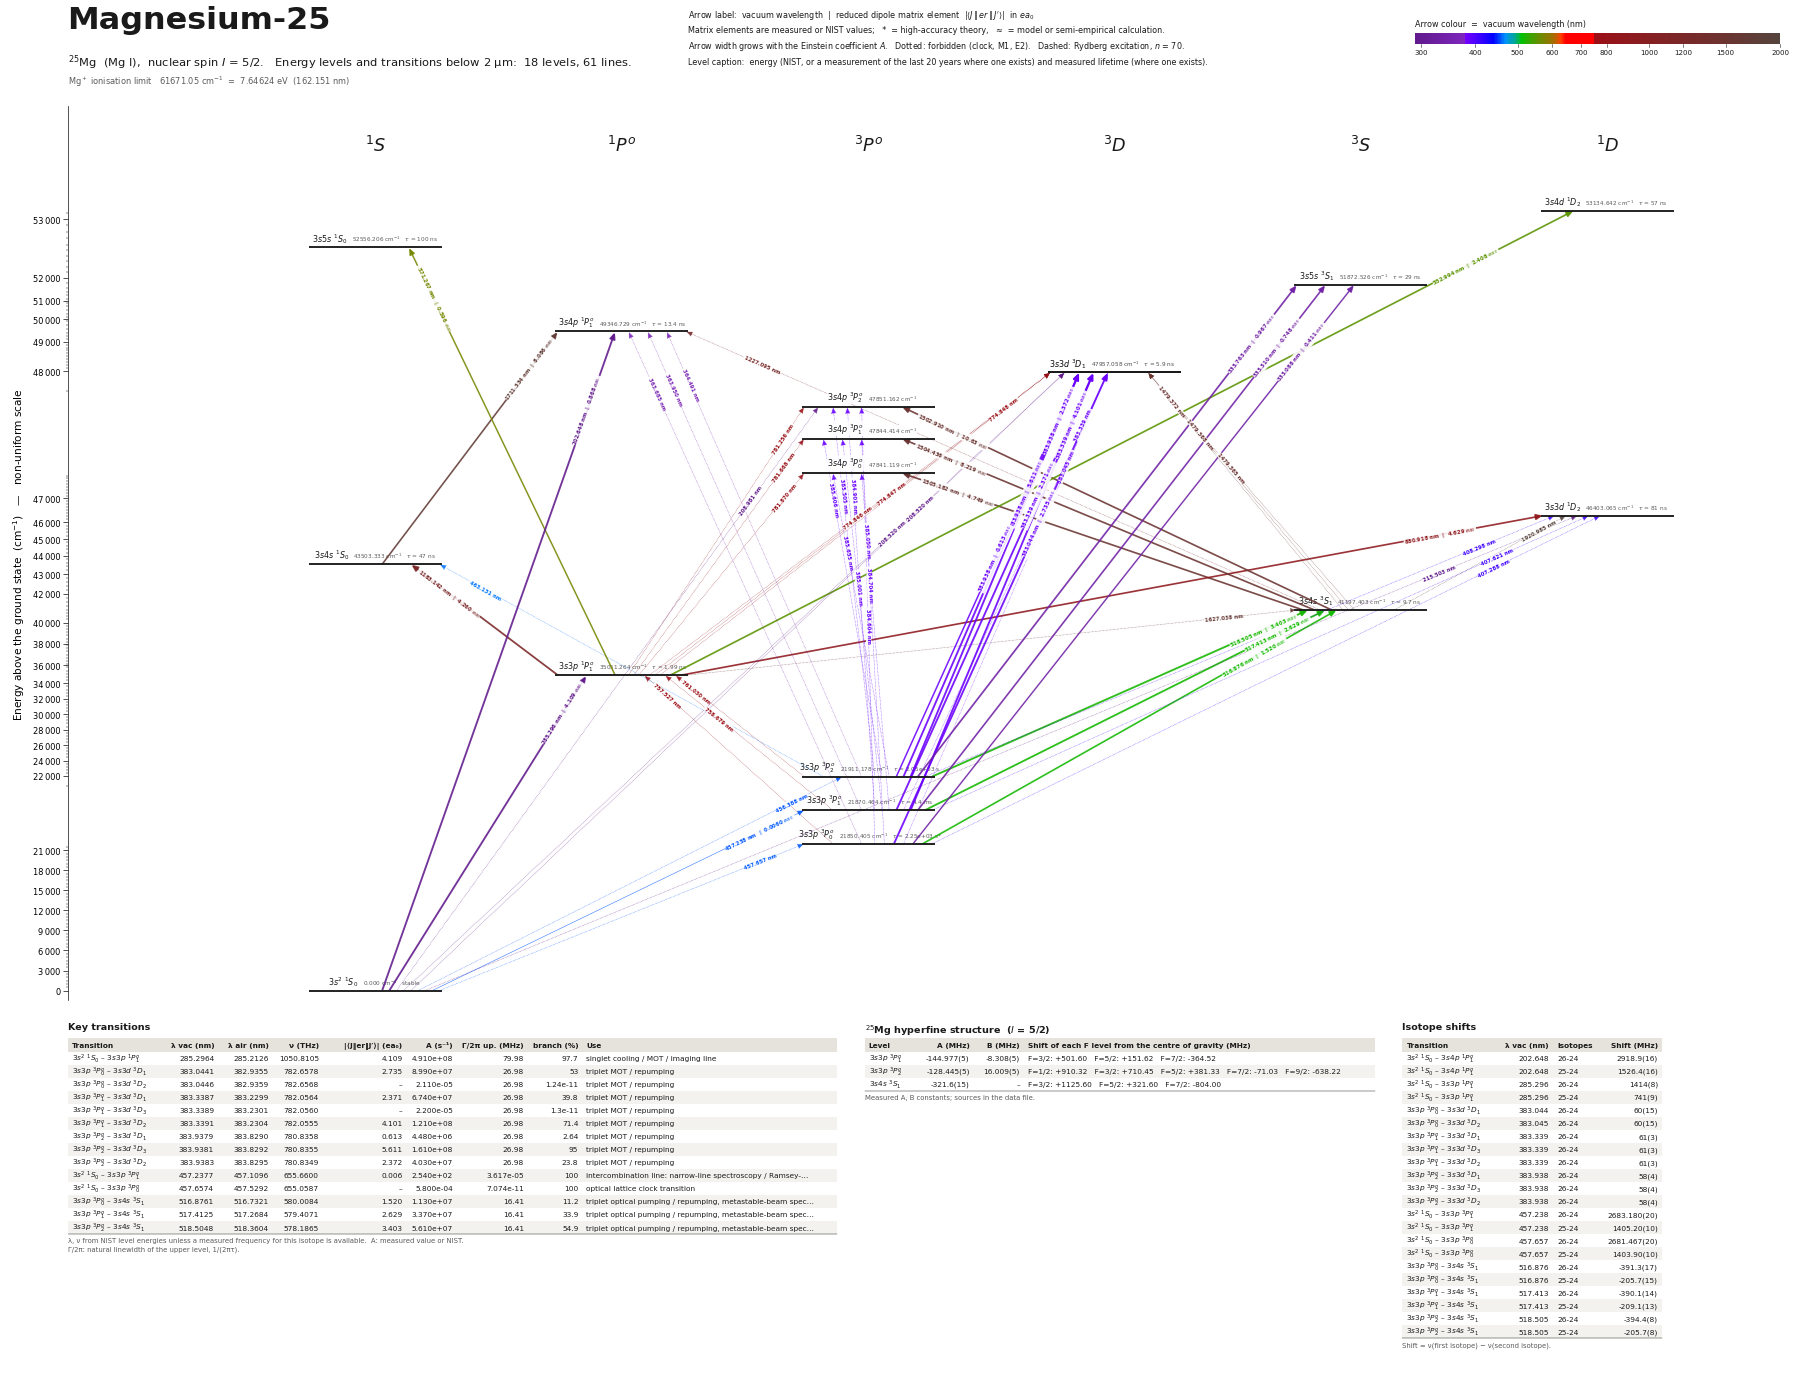 Magnesium-25 (25Mg)18 levels, 61 transitions below 2 µm
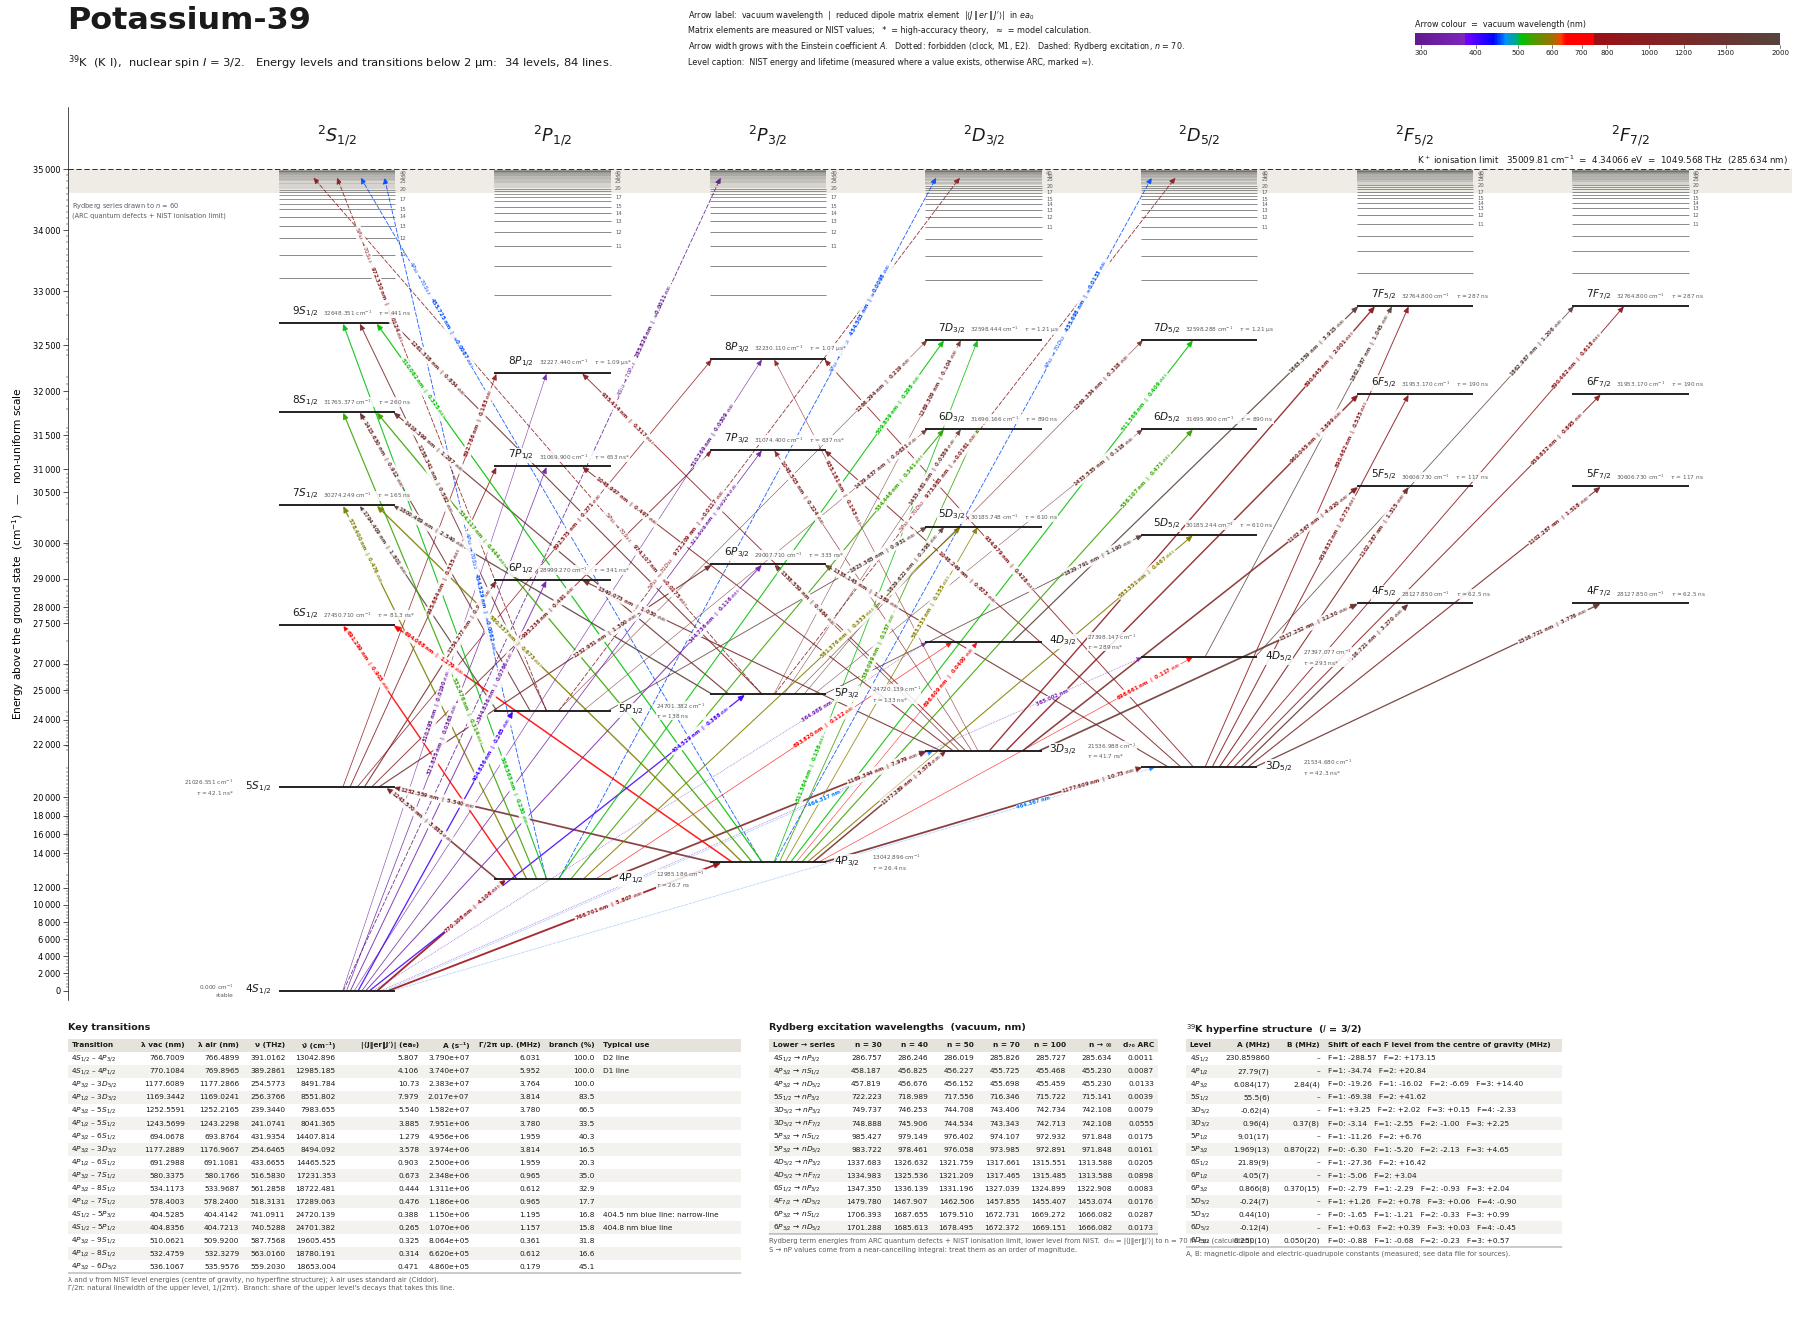 Potassium-39 (39K)34 levels, 84 transitions below 2 µm
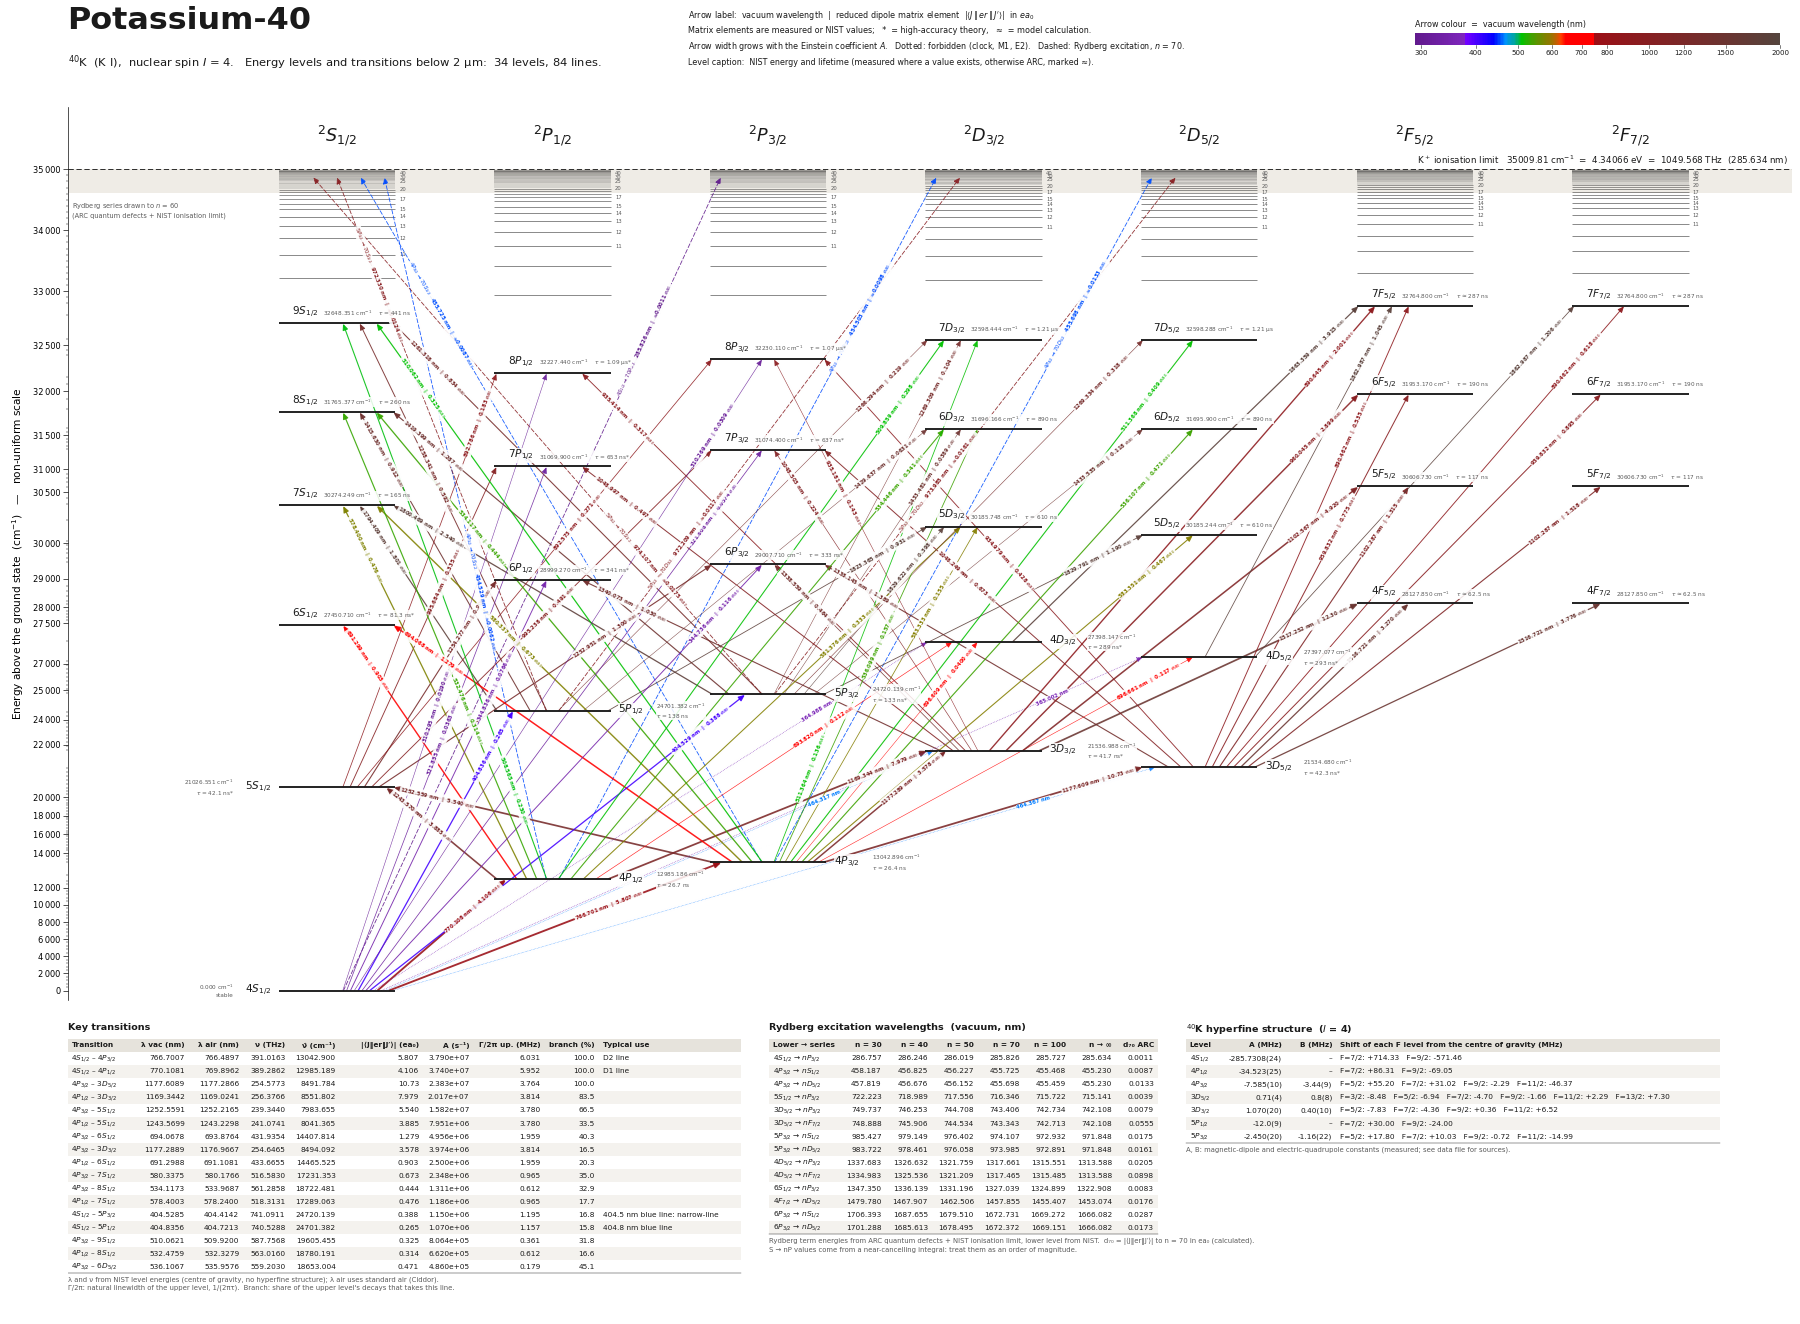 Potassium-40 (40K)34 levels, 84 transitions below 2 µm
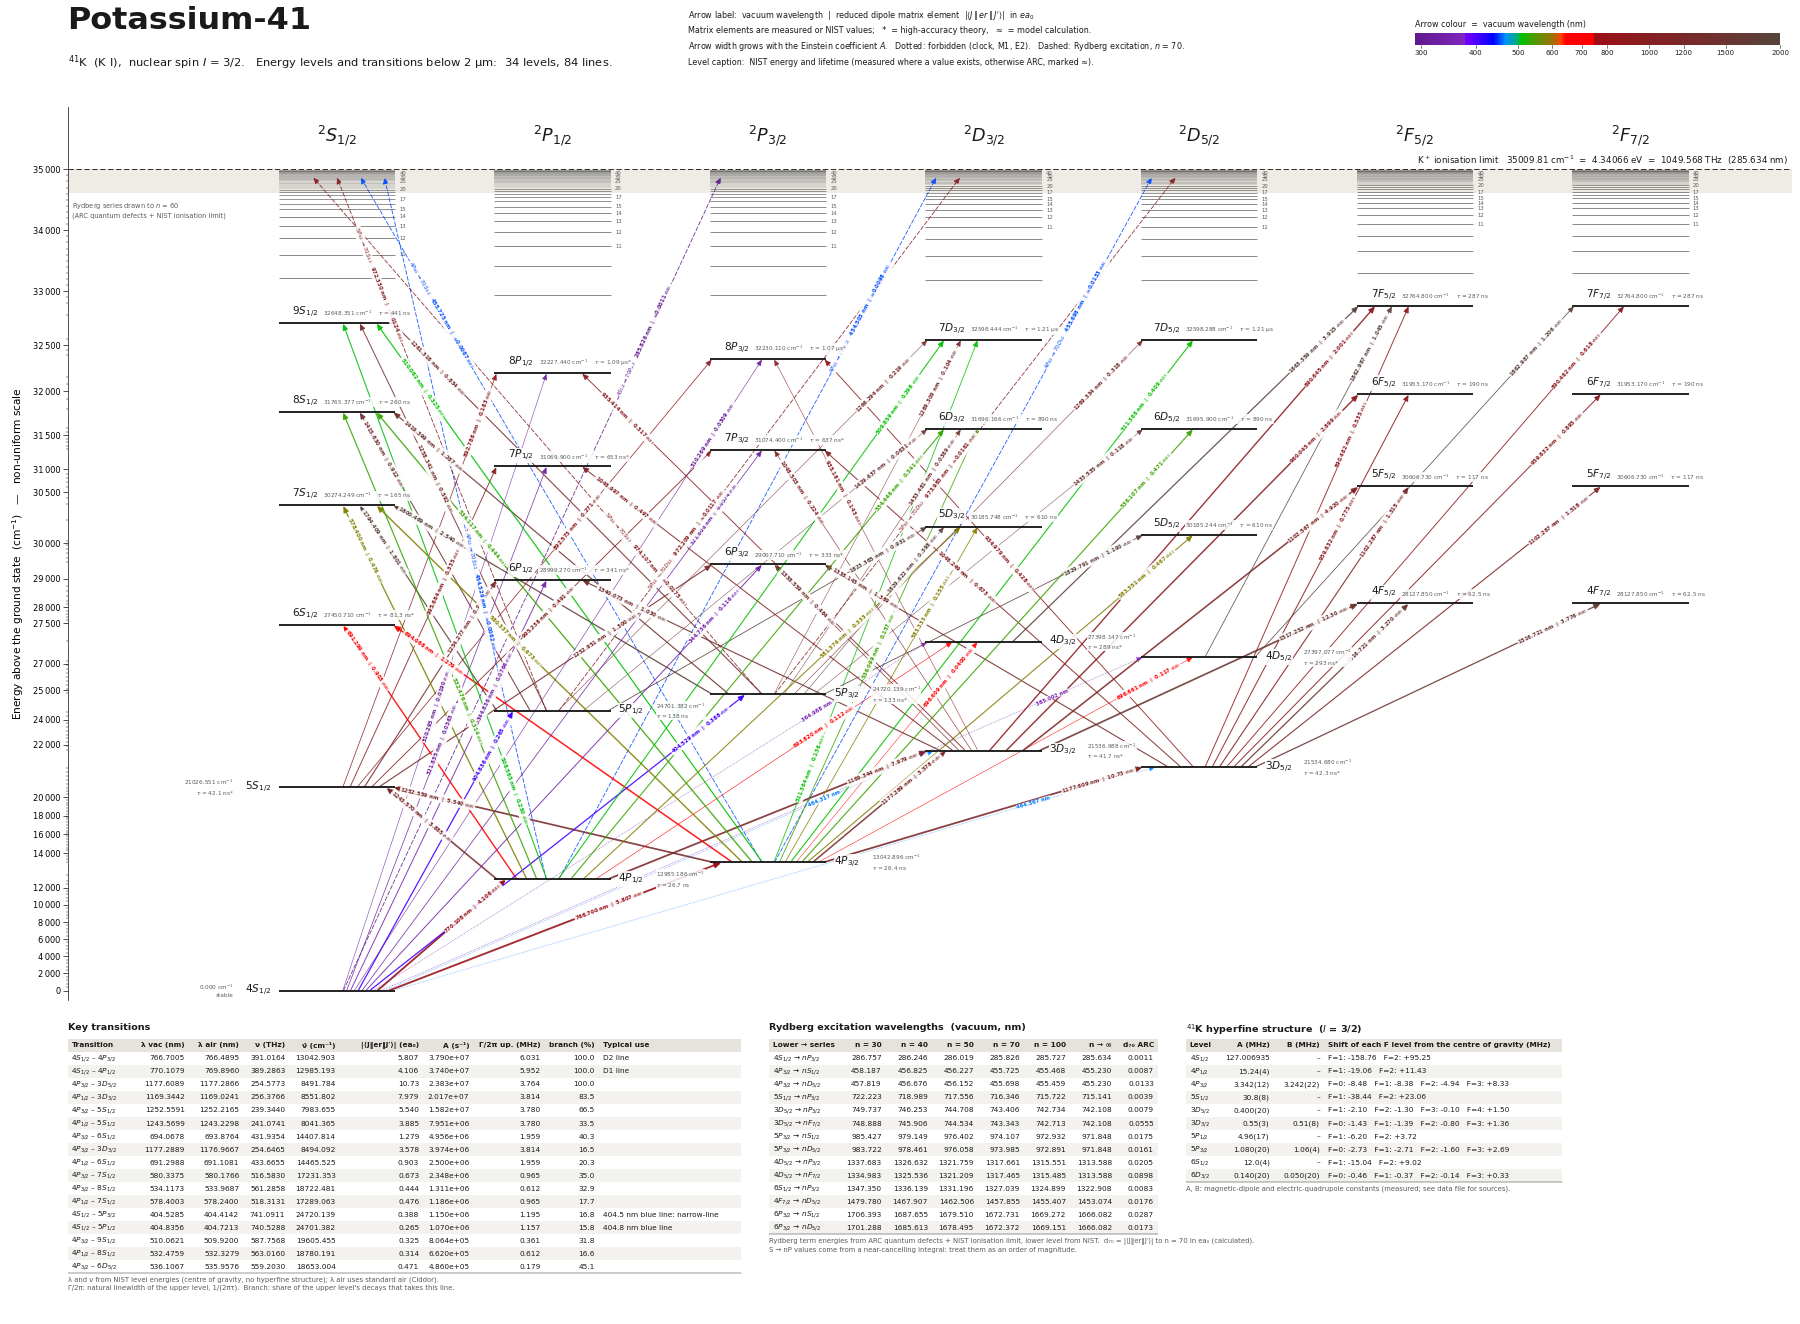 Potassium-41 (41K)34 levels, 84 transitions below 2 µm
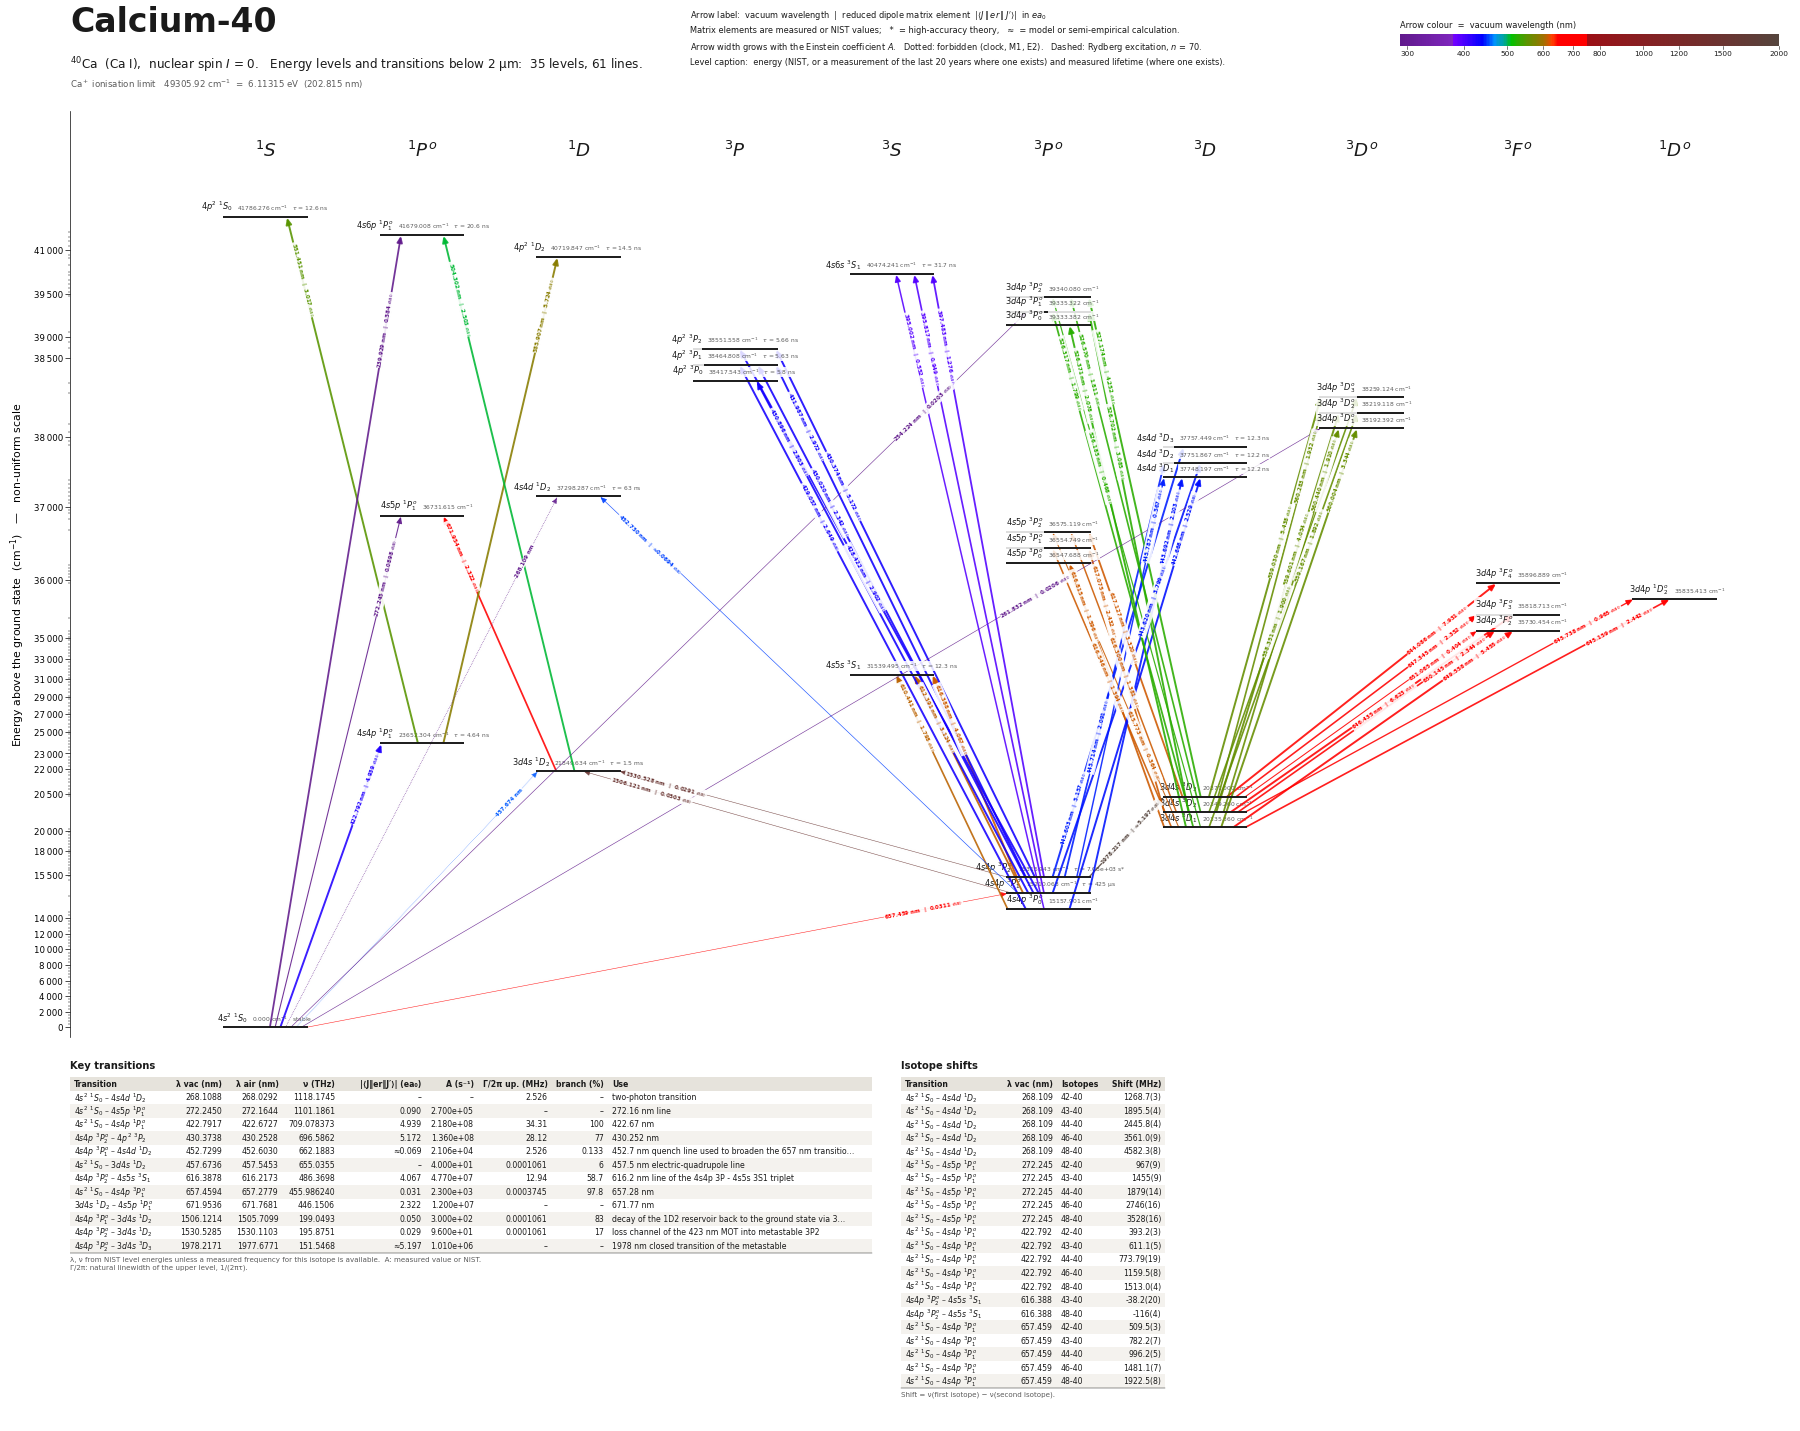 Calcium-40 (40Ca)35 levels, 61 transitions below 2 µm
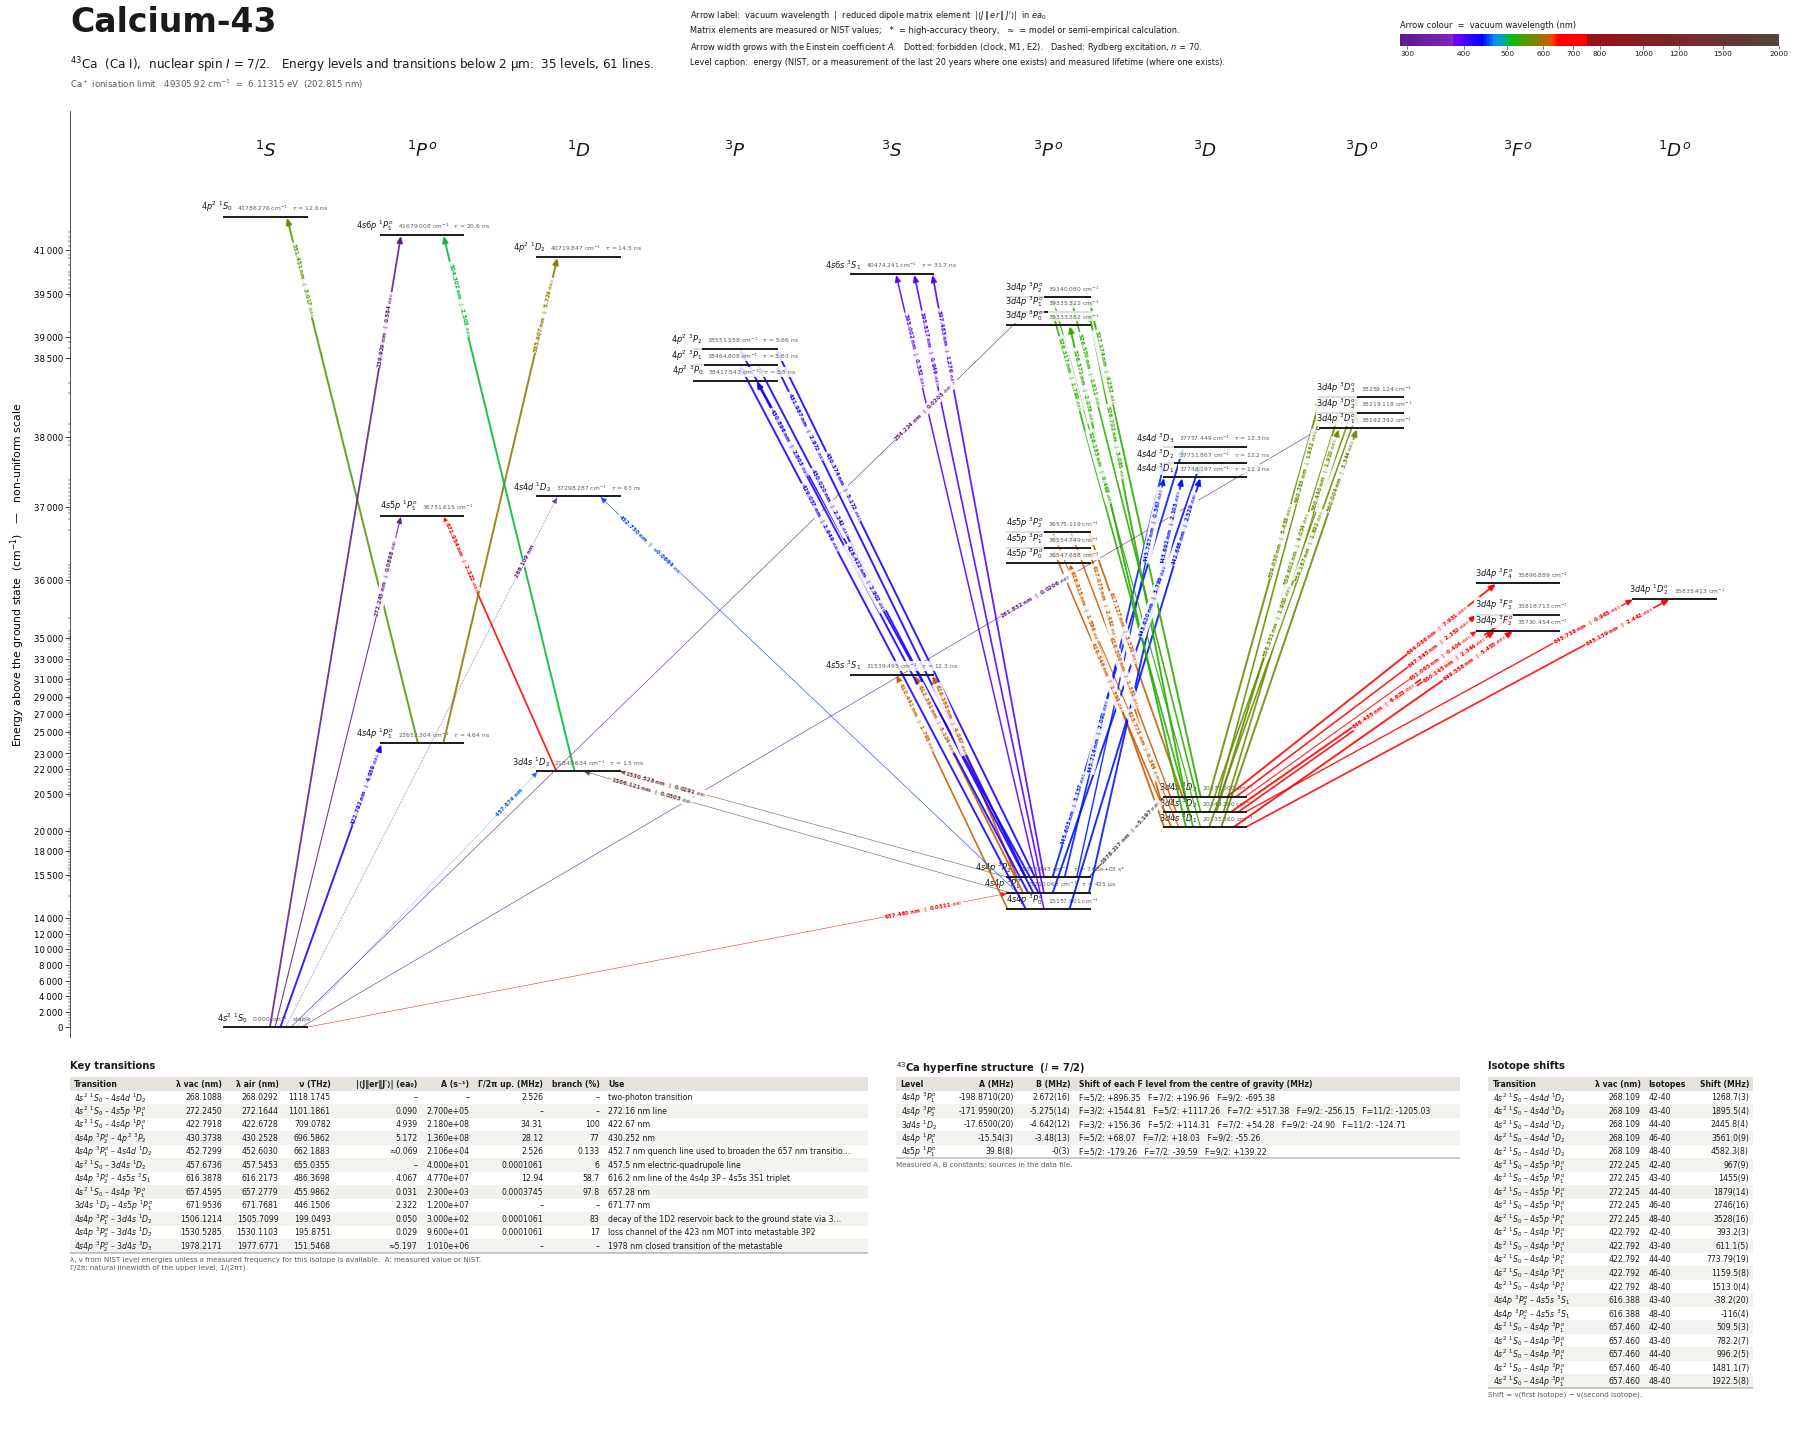 Calcium-43 (43Ca)35 levels, 61 transitions below 2 µm
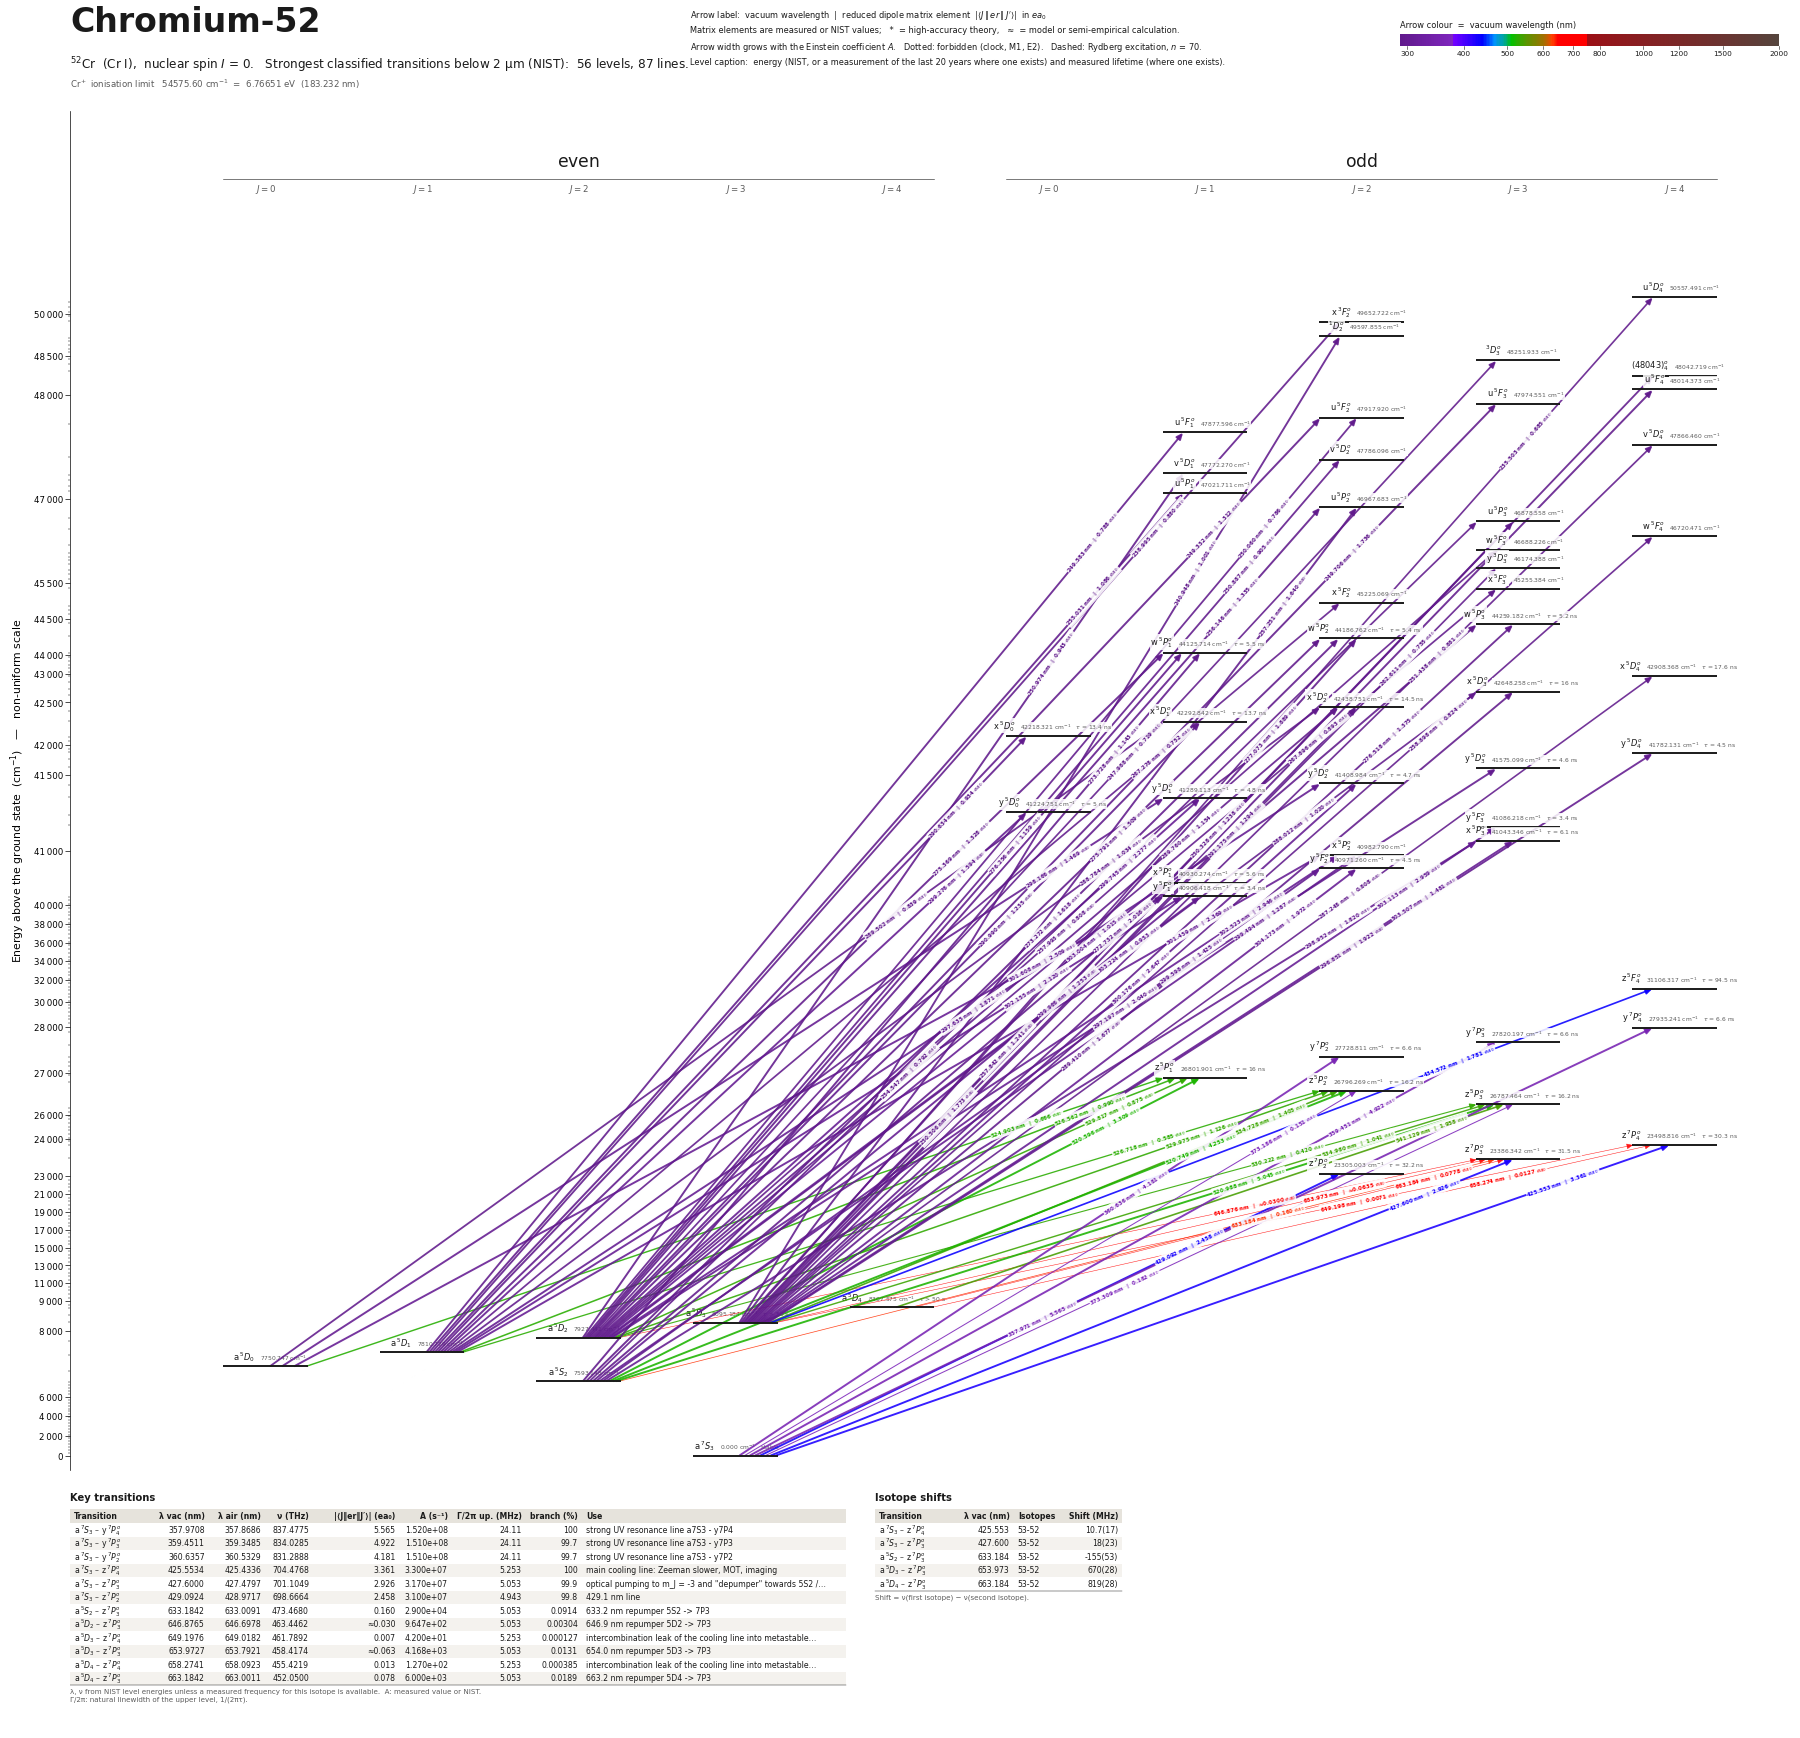 Chromium-52 (52Cr)56 levels, 87 transitions below 2 µm
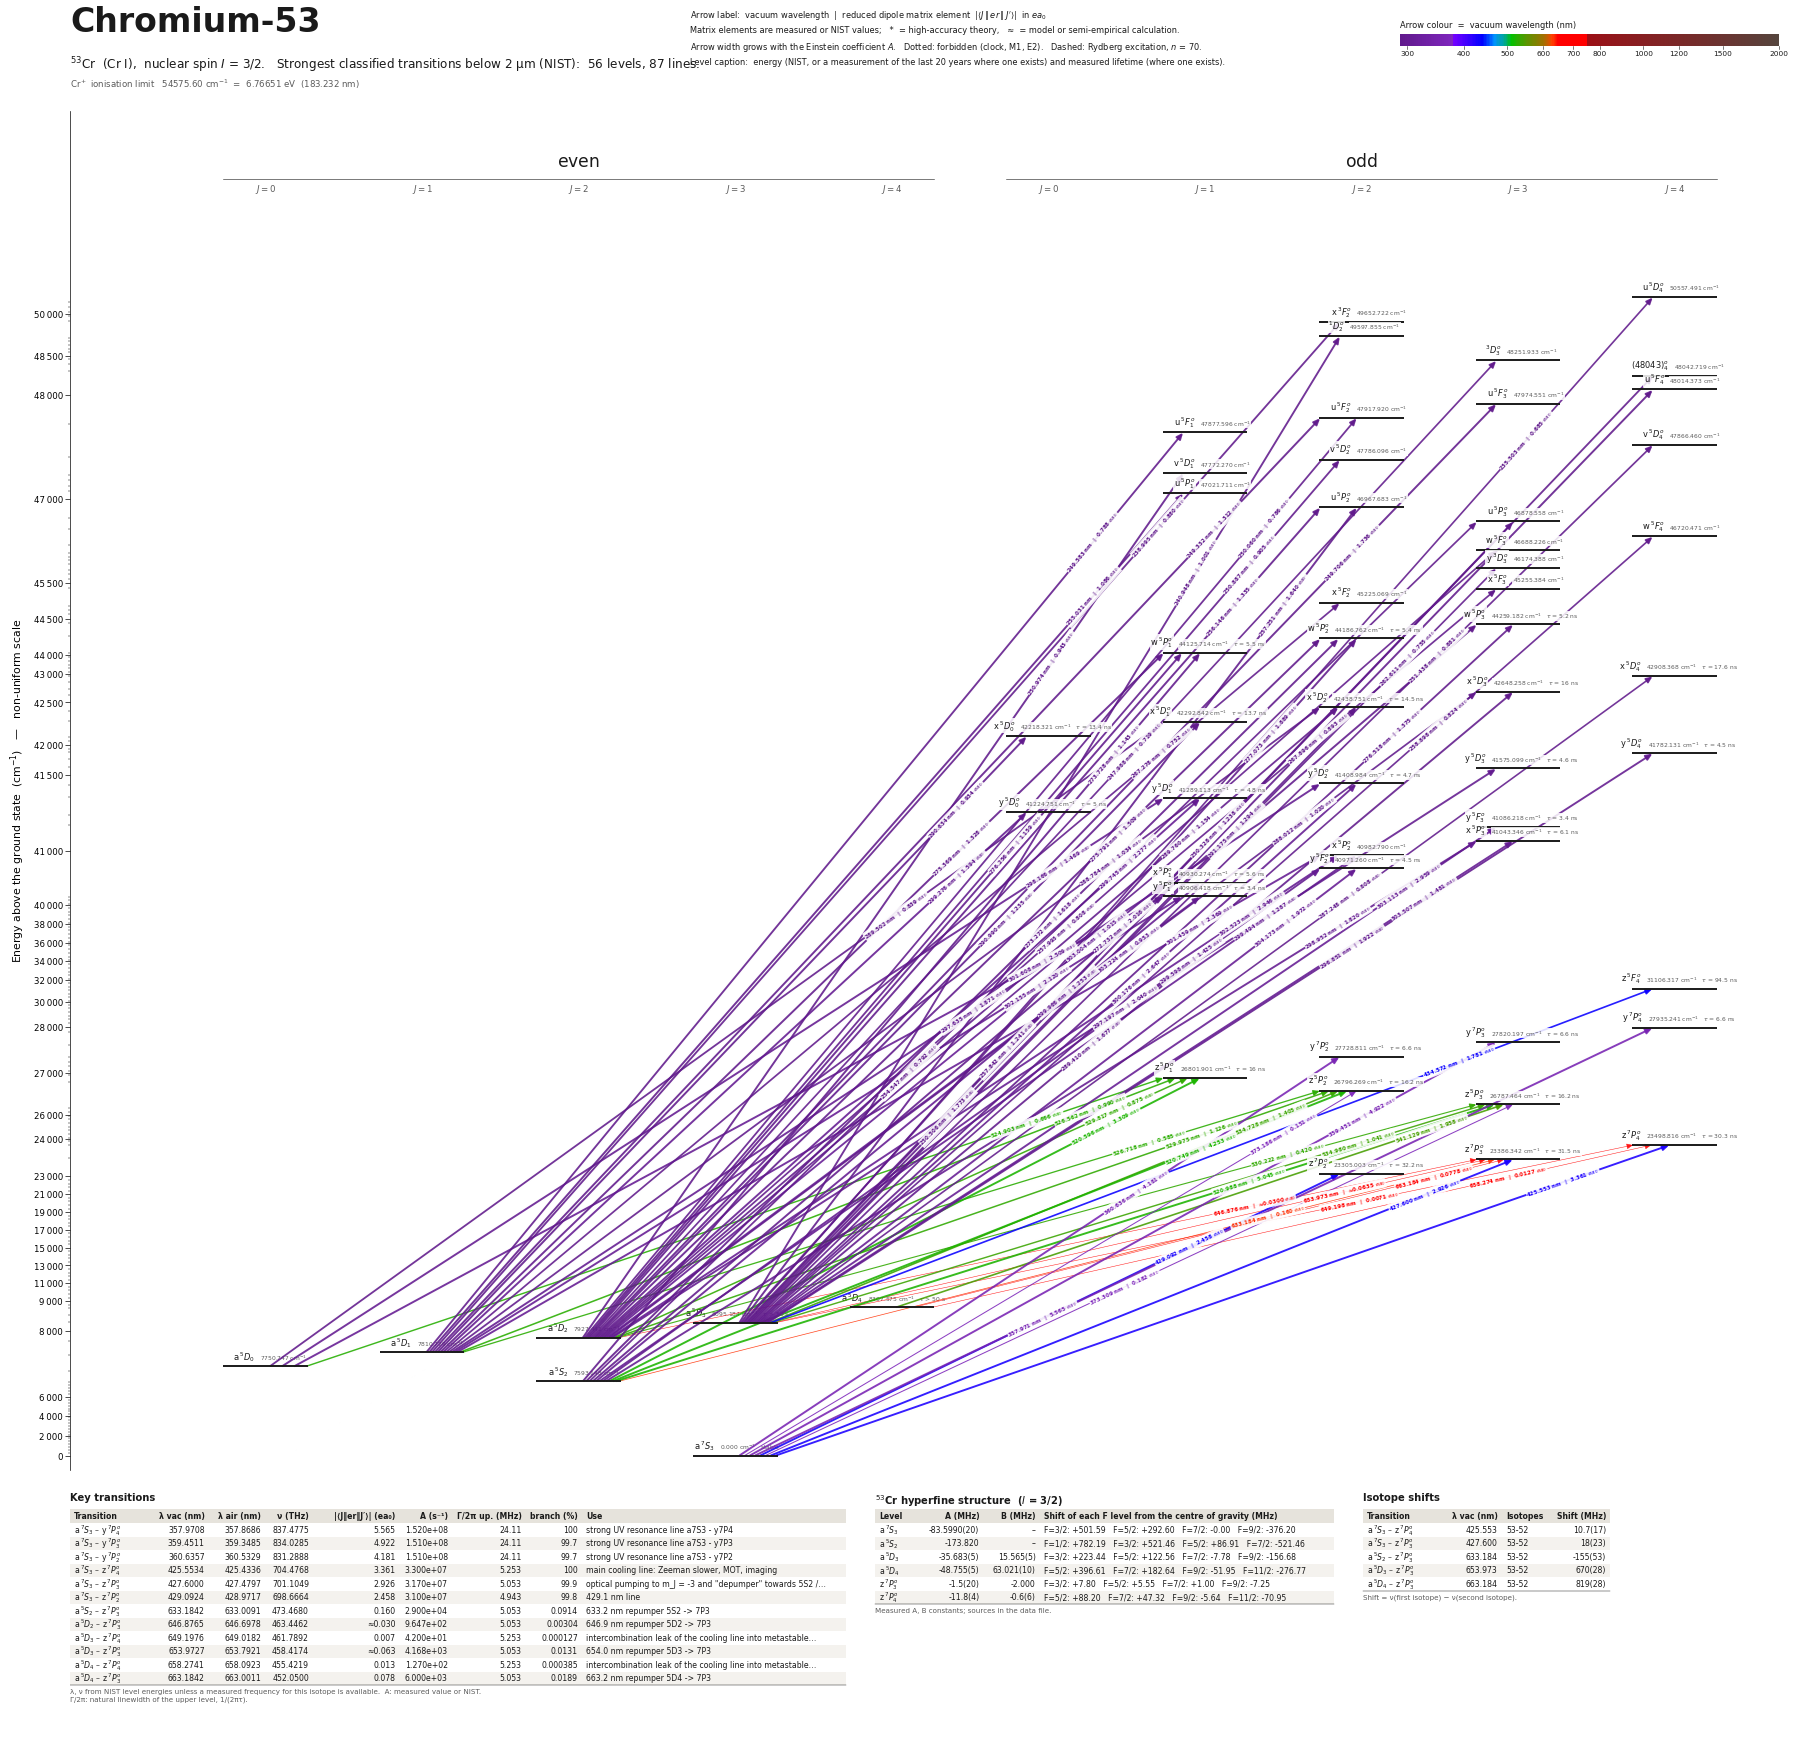 Chromium-53 (53Cr)56 levels, 87 transitions below 2 µm
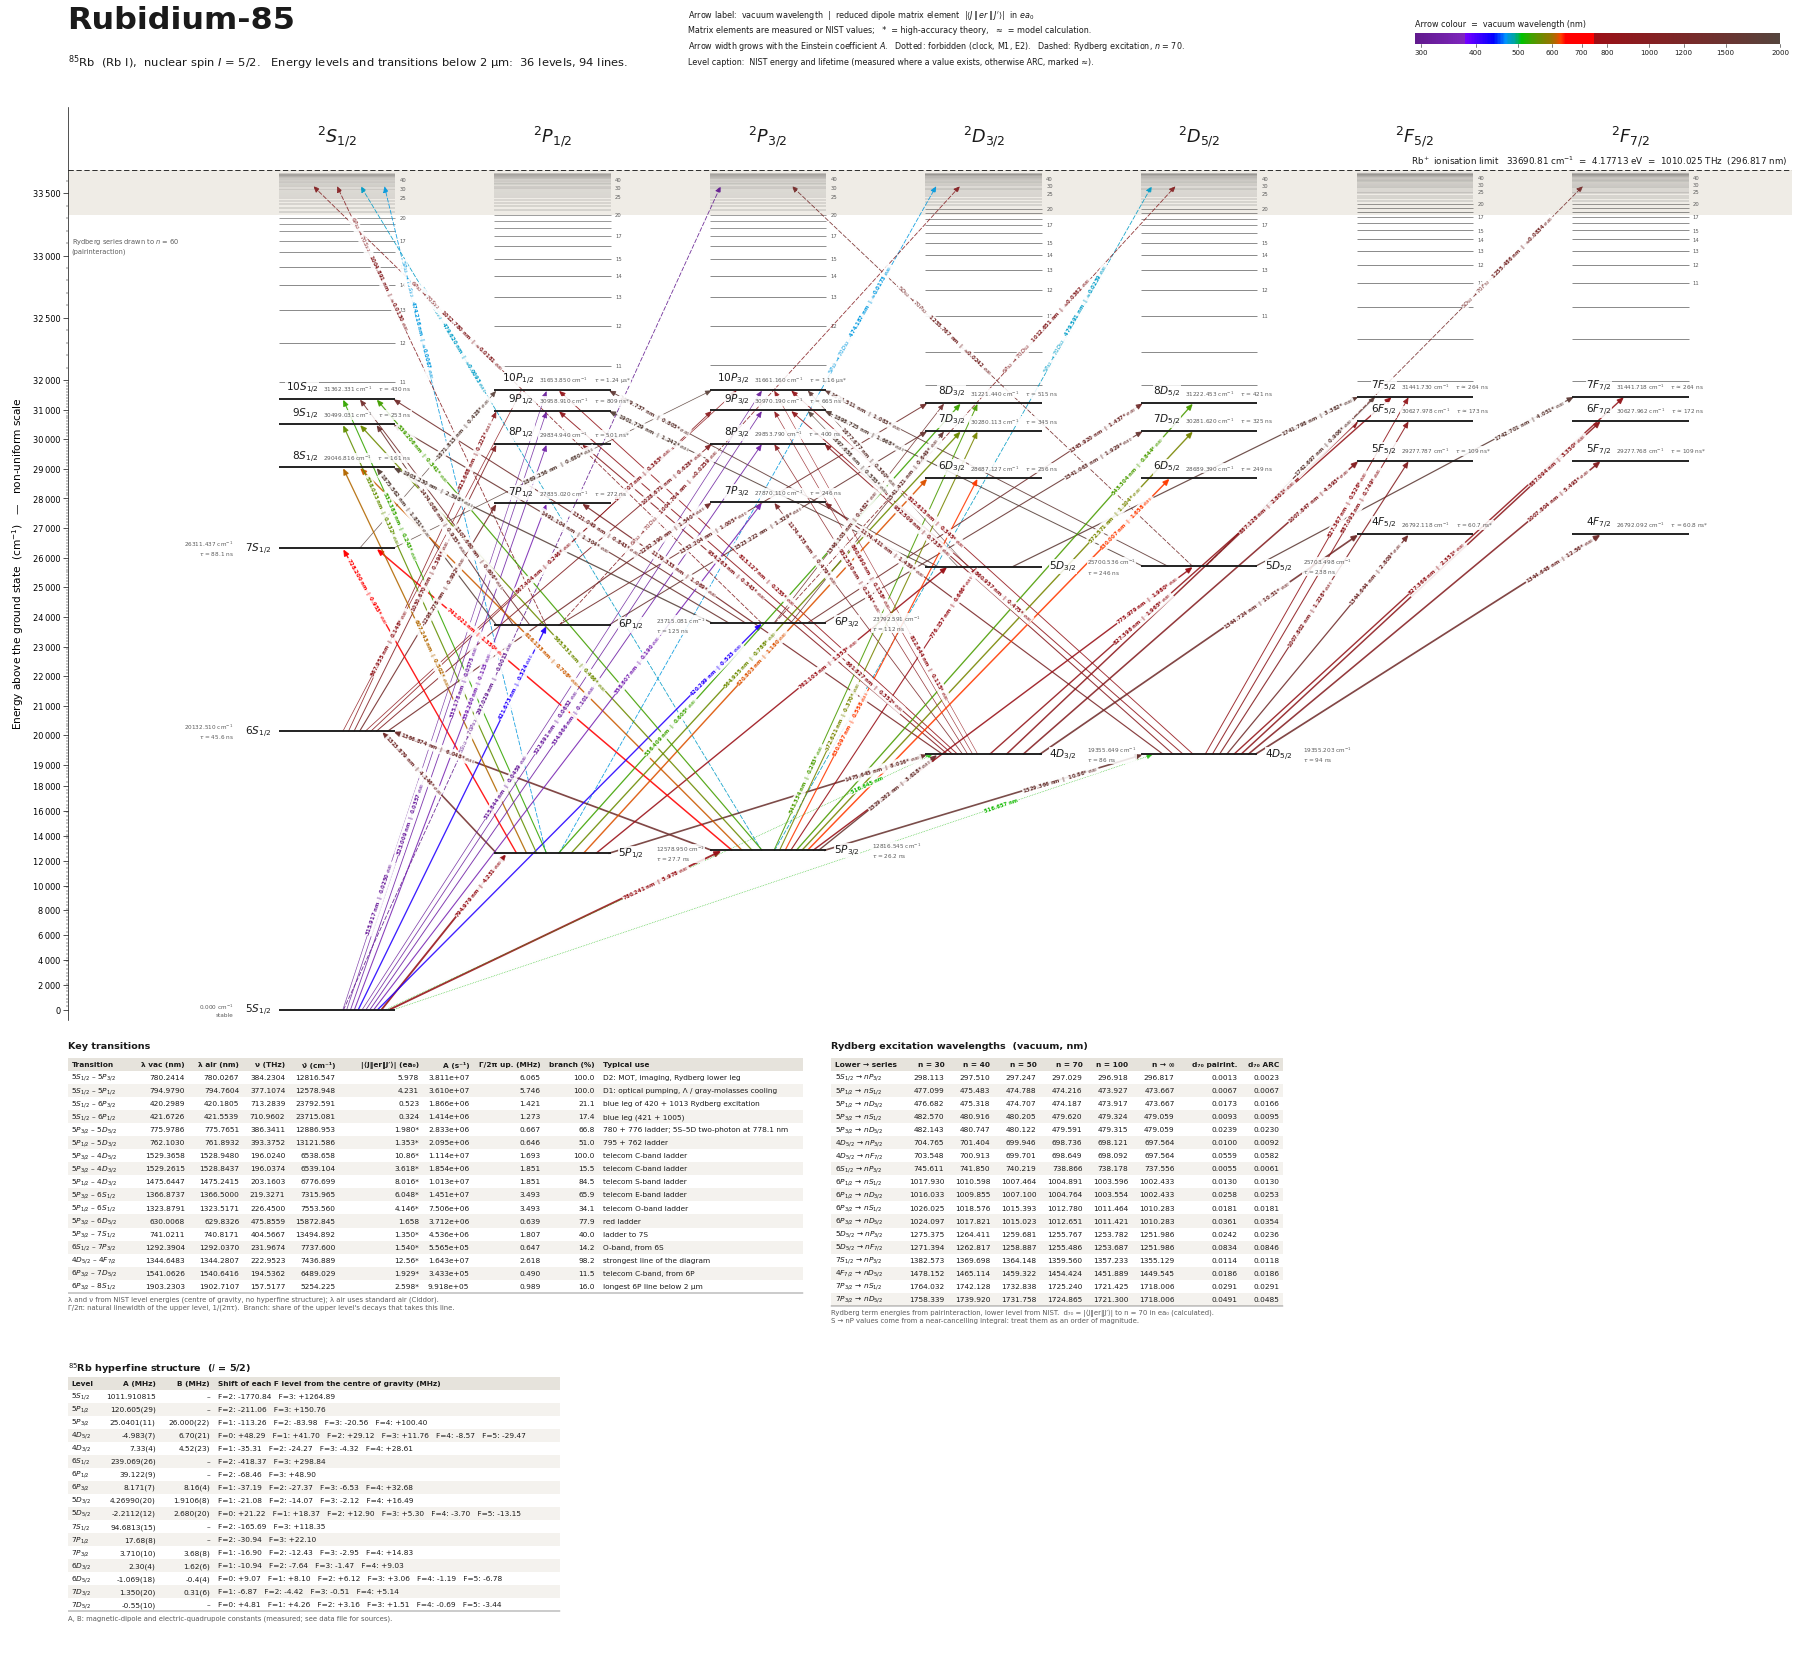 Rubidium-85 (85Rb)36 levels, 94 transitions below 2 µm
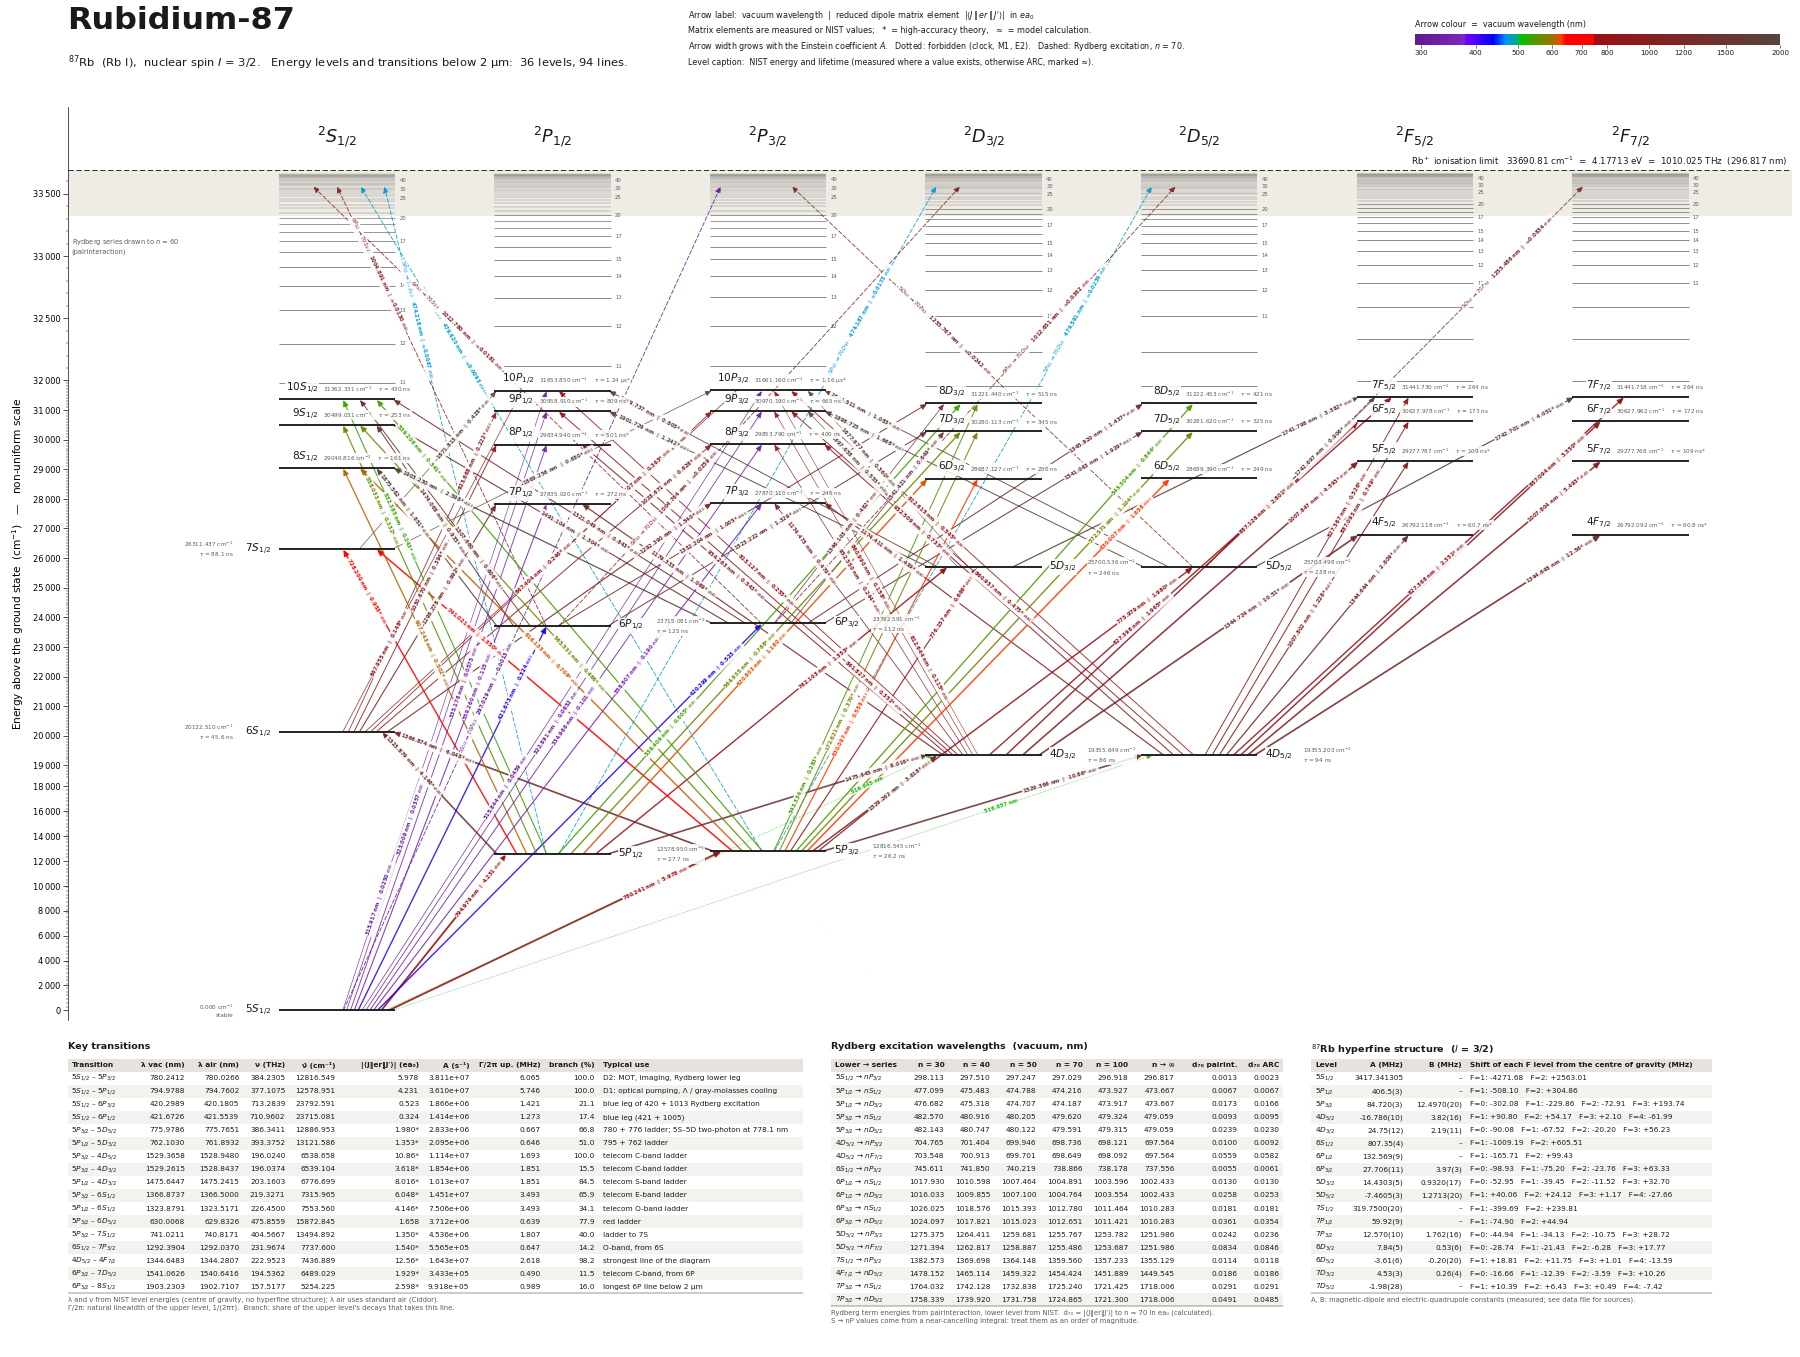 Rubidium-87 (87Rb)36 levels, 94 transitions below 2 µm
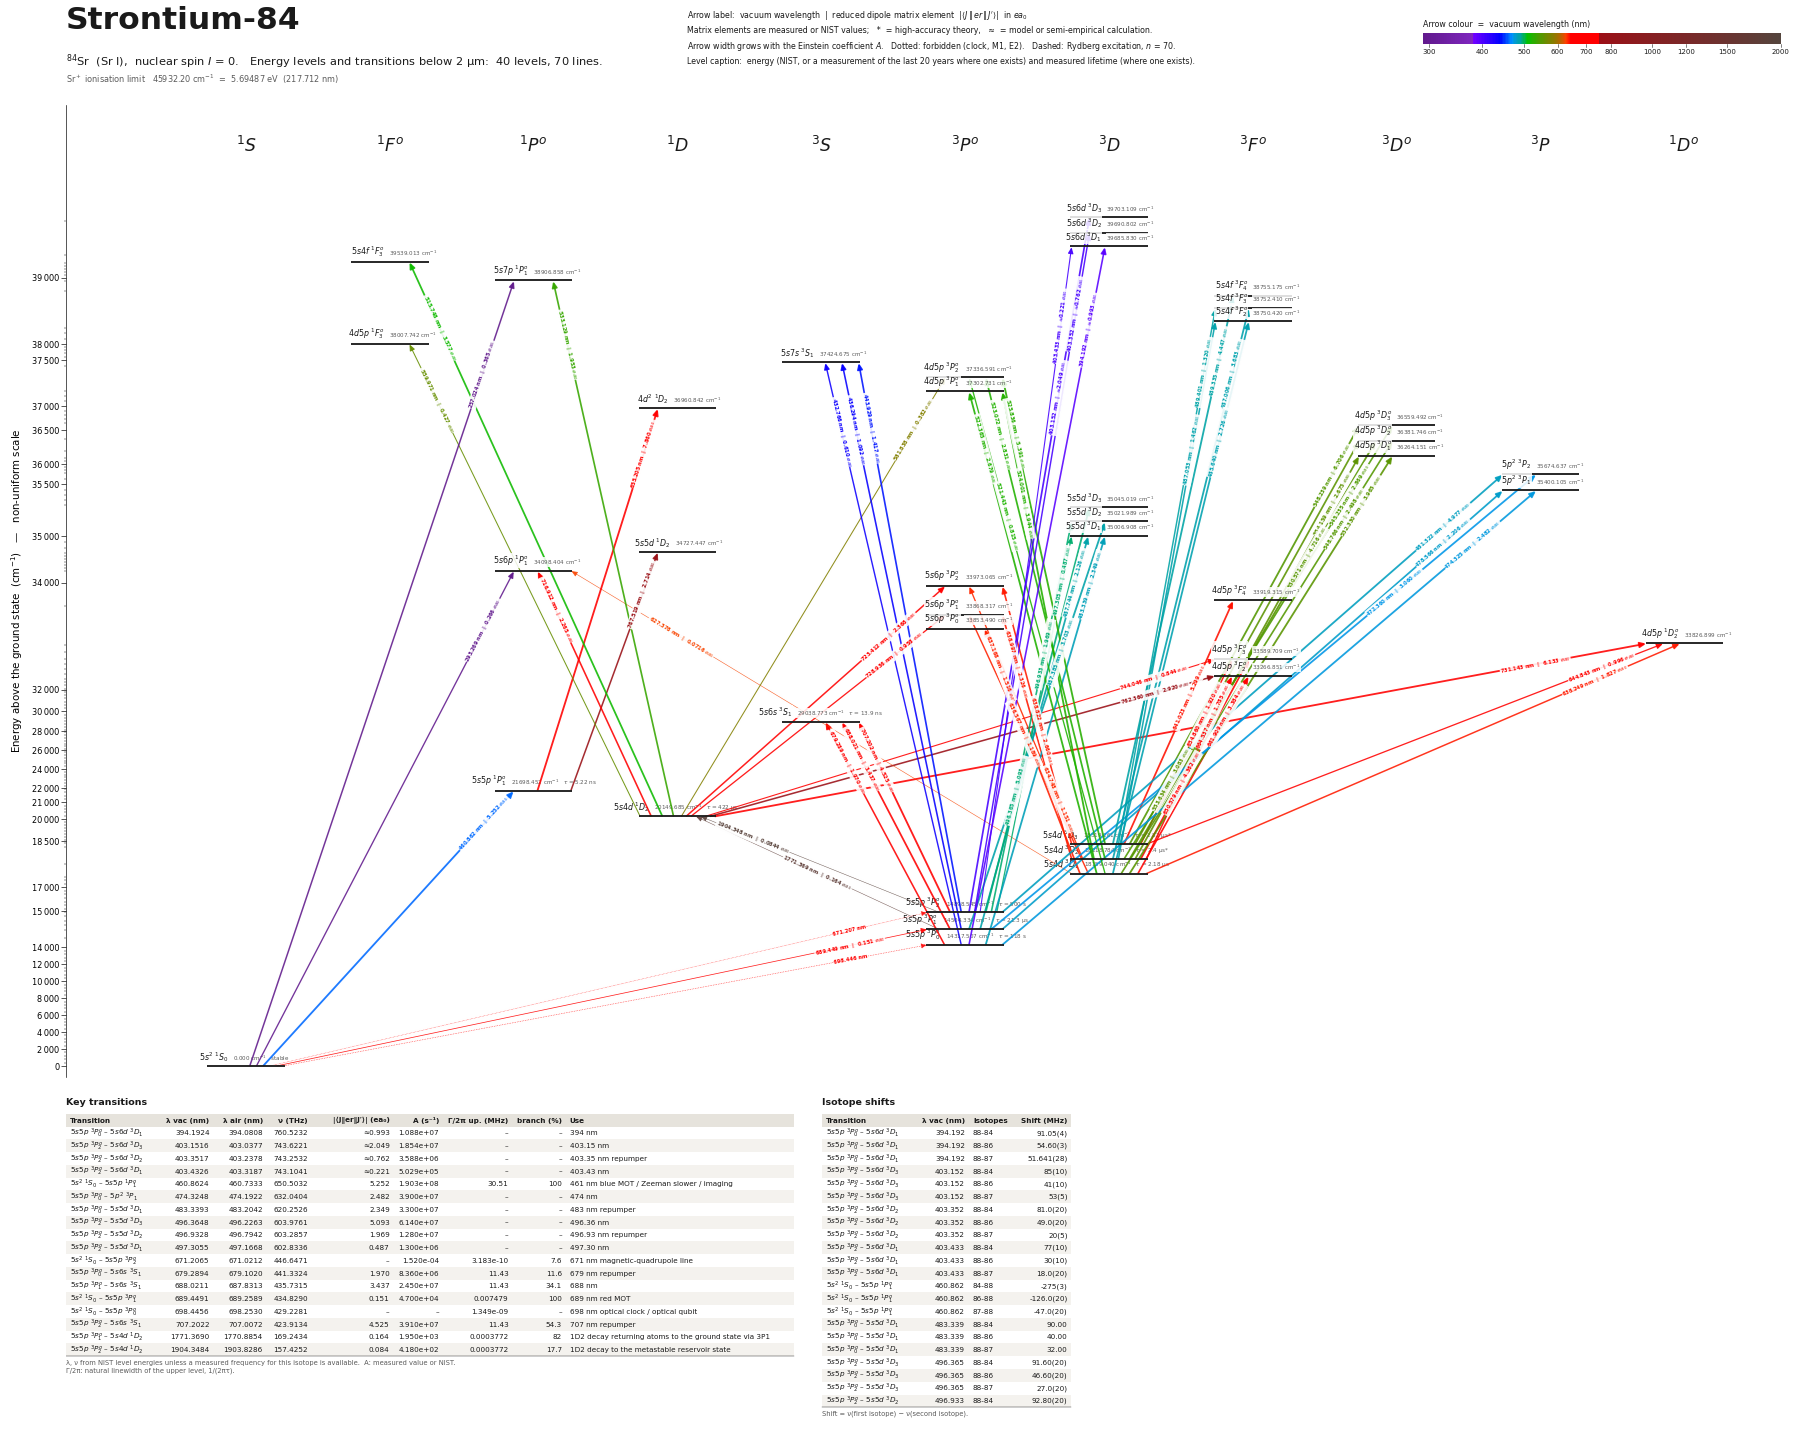 Strontium-84 (84Sr)40 levels, 70 transitions below 2 µm
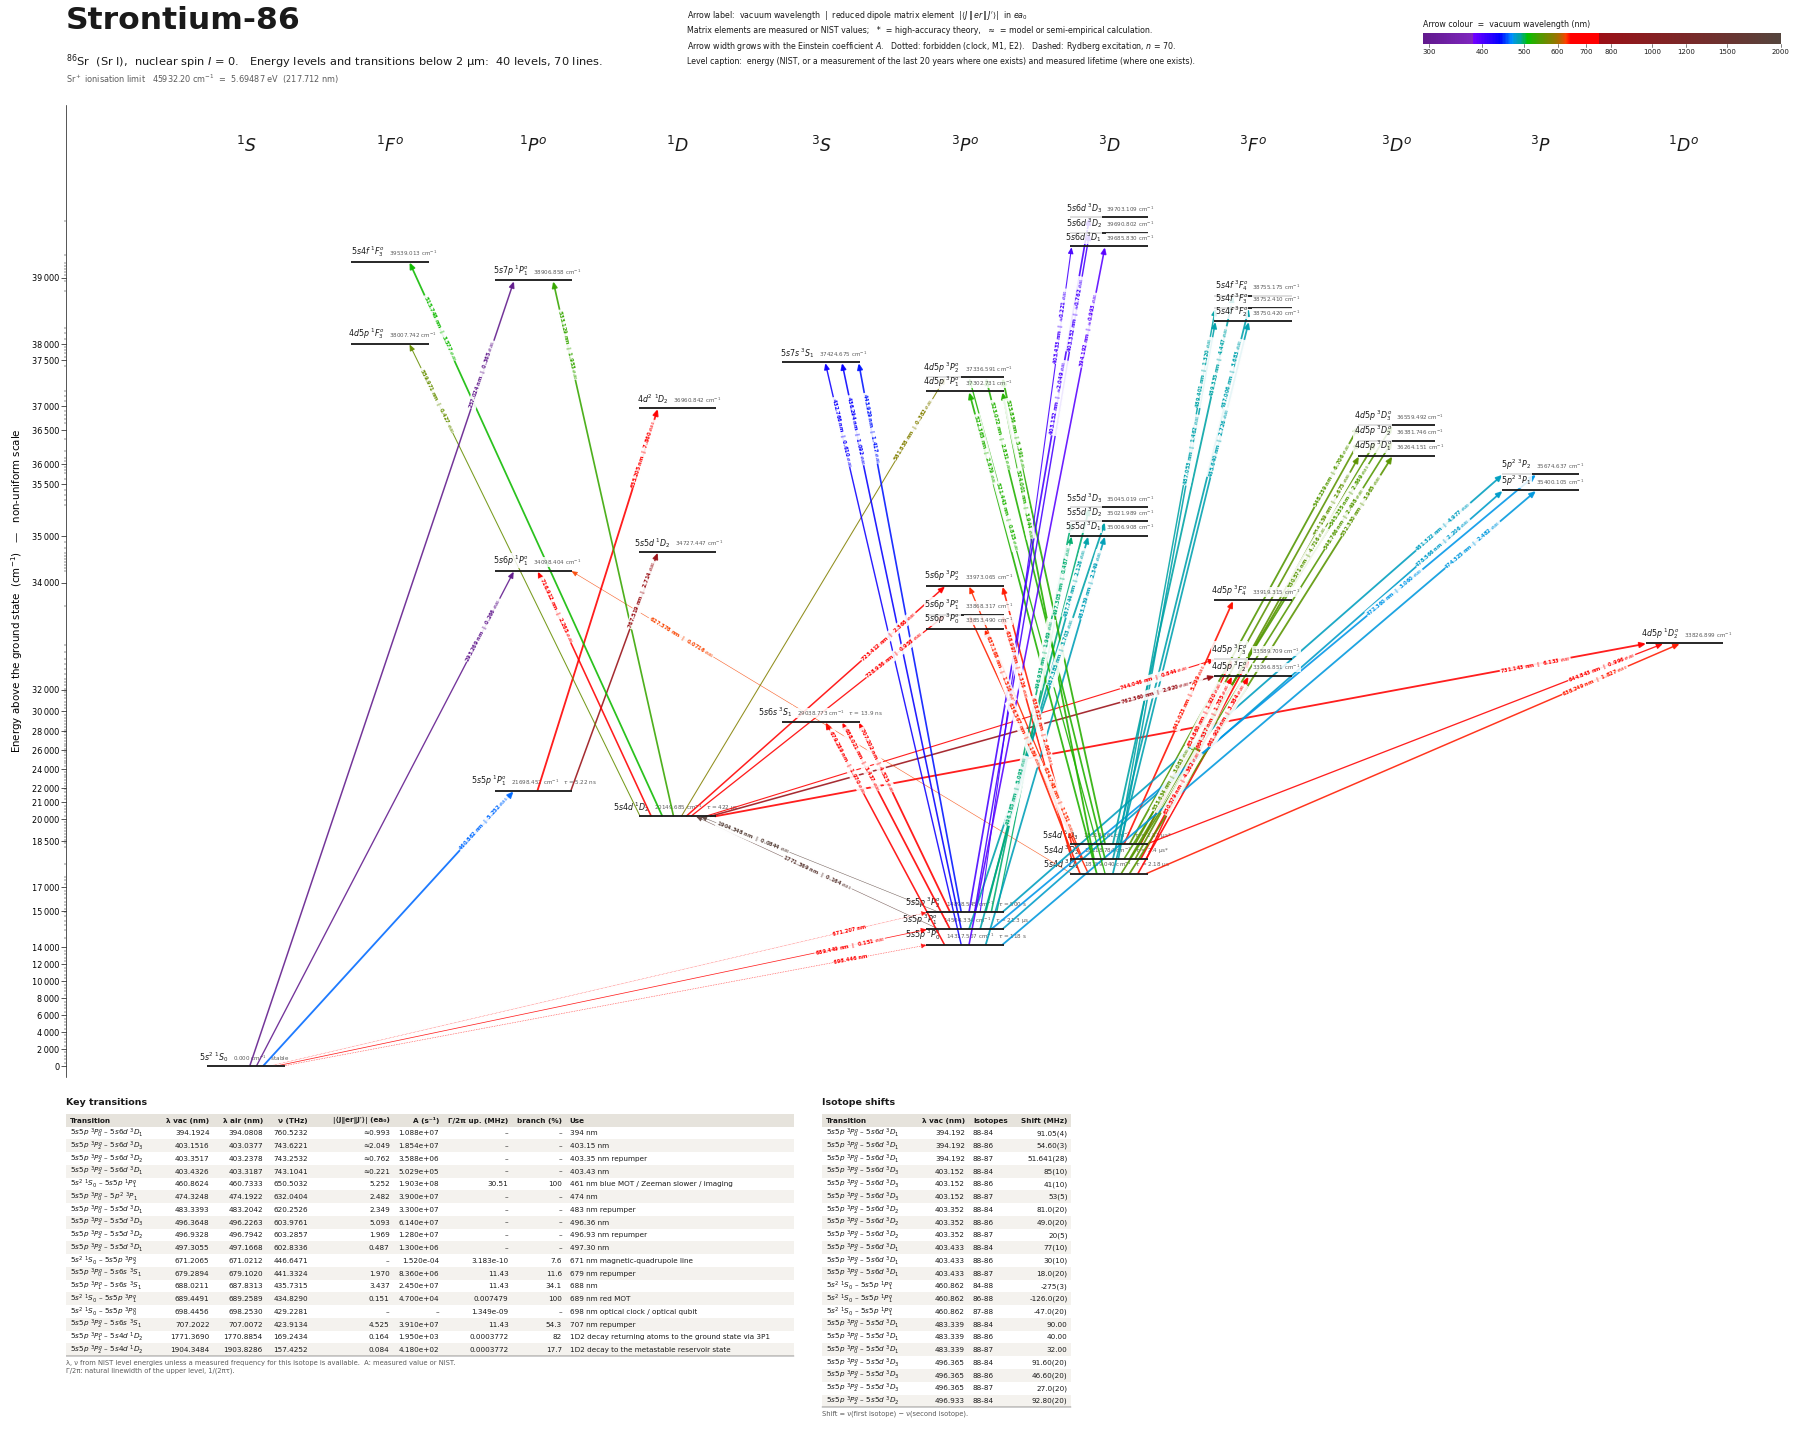 Strontium-86 (86Sr)40 levels, 70 transitions below 2 µm
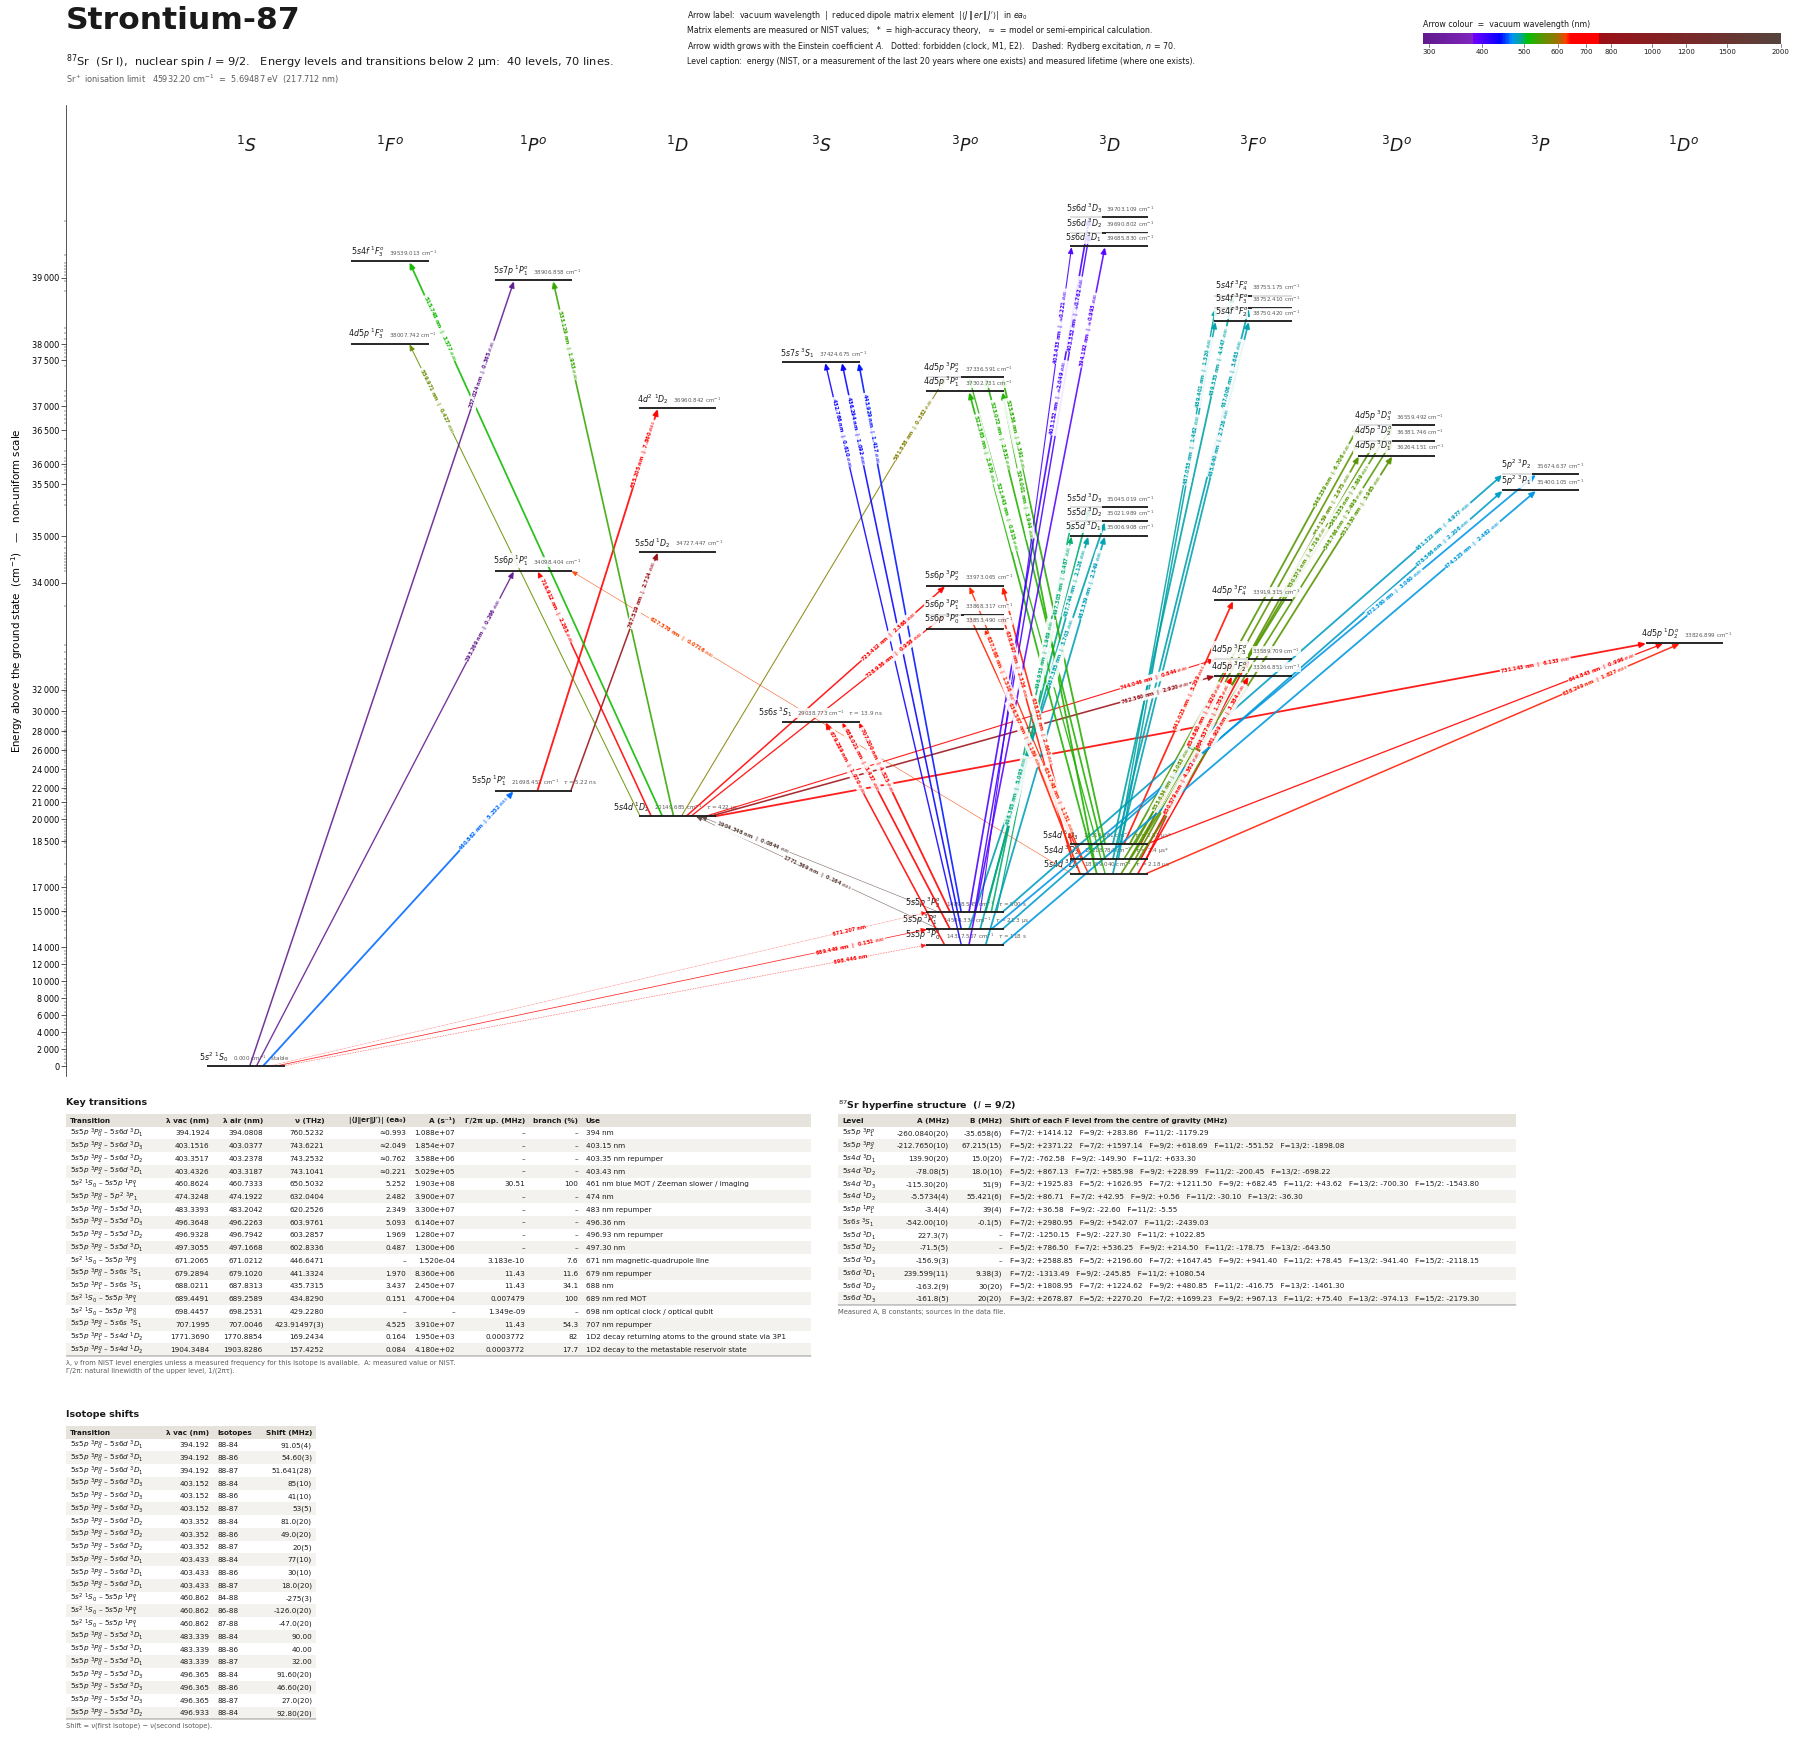 Strontium-87 (87Sr)40 levels, 70 transitions below 2 µm
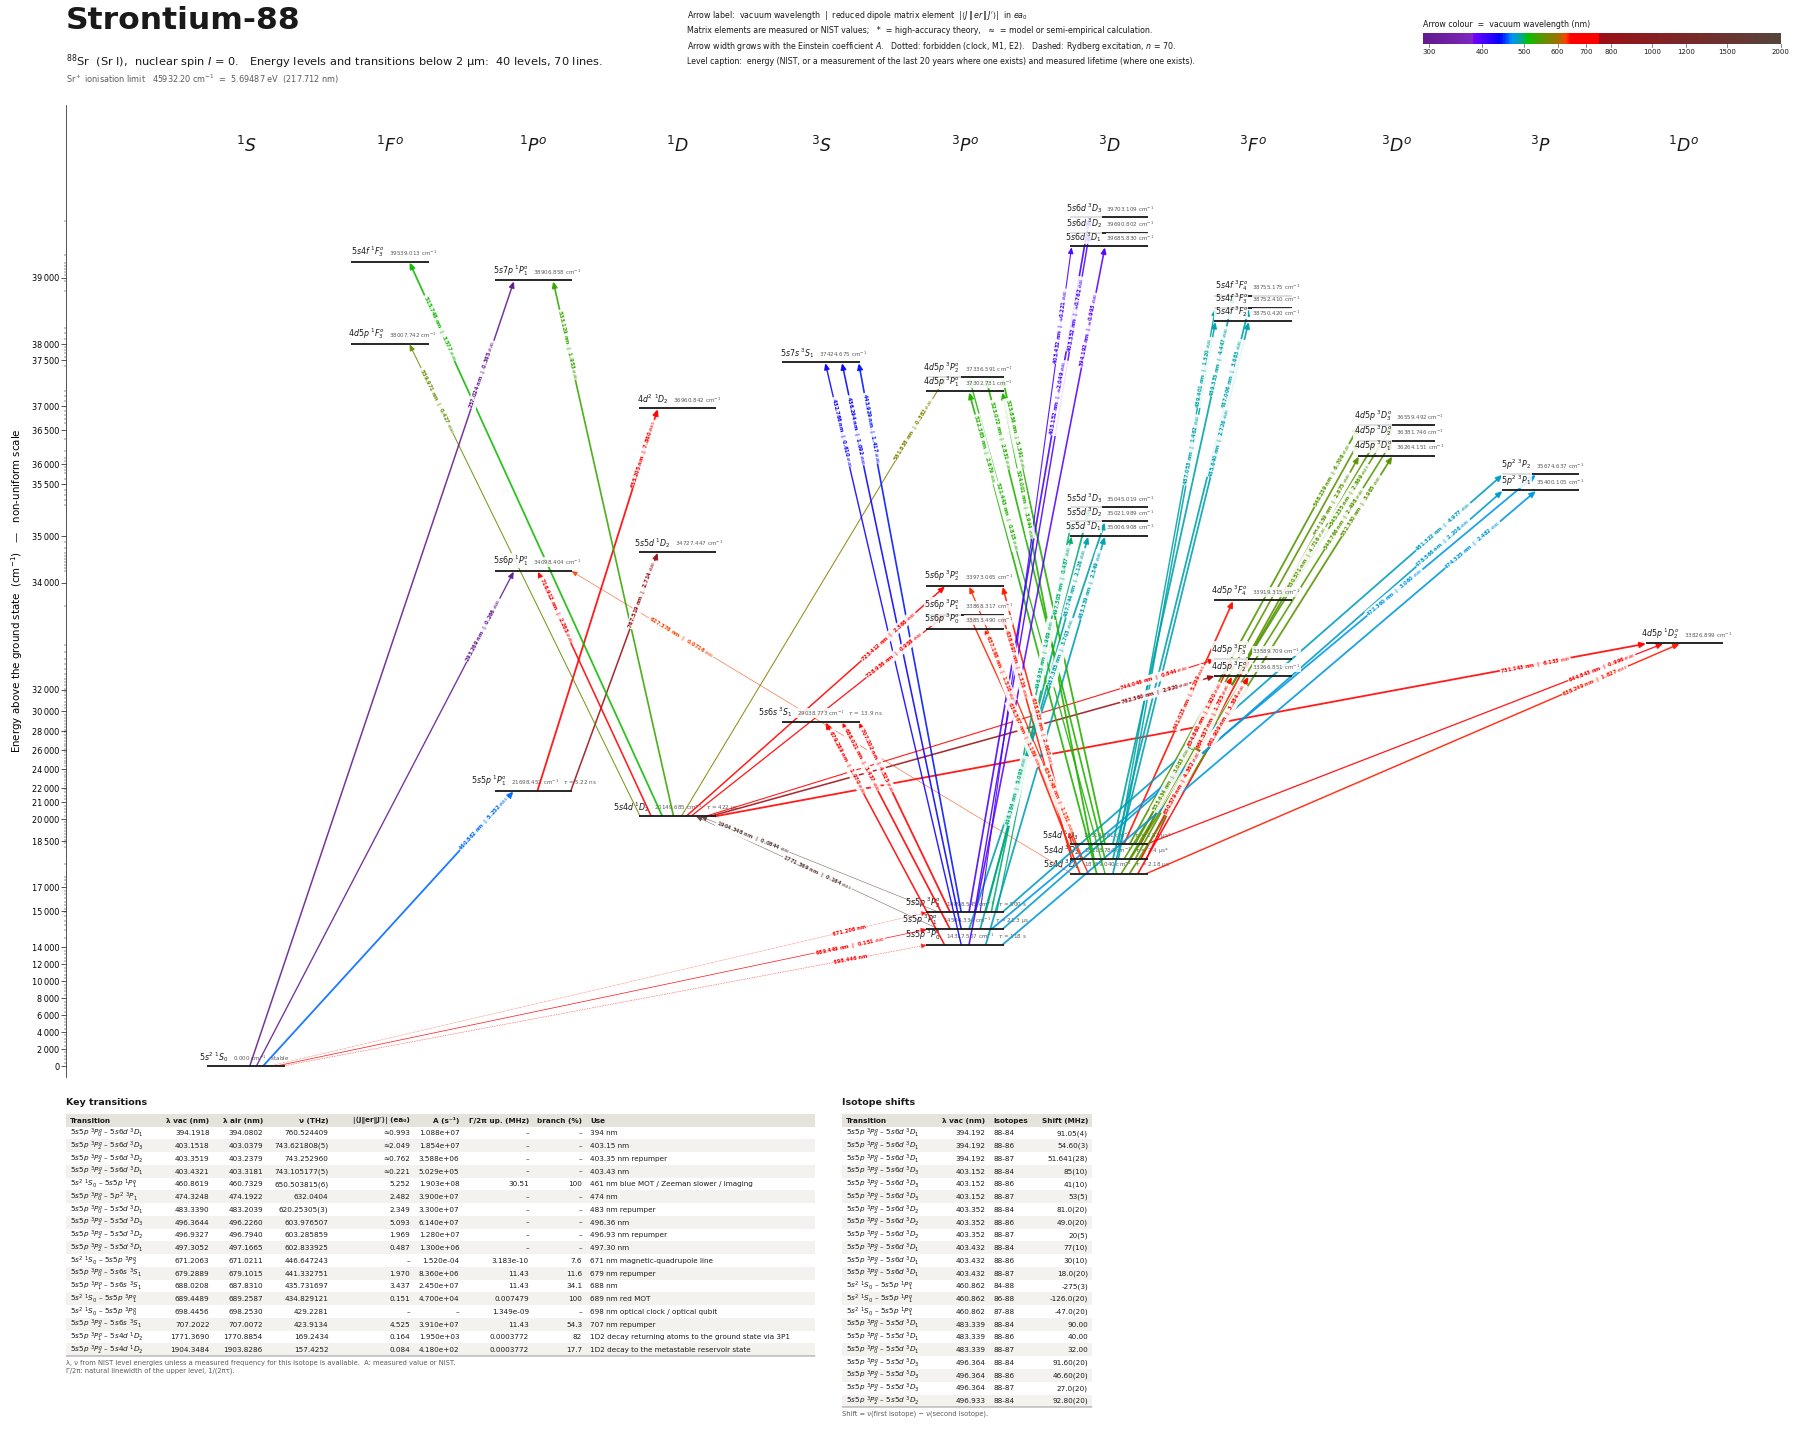 Strontium-88 (88Sr)40 levels, 70 transitions below 2 µm
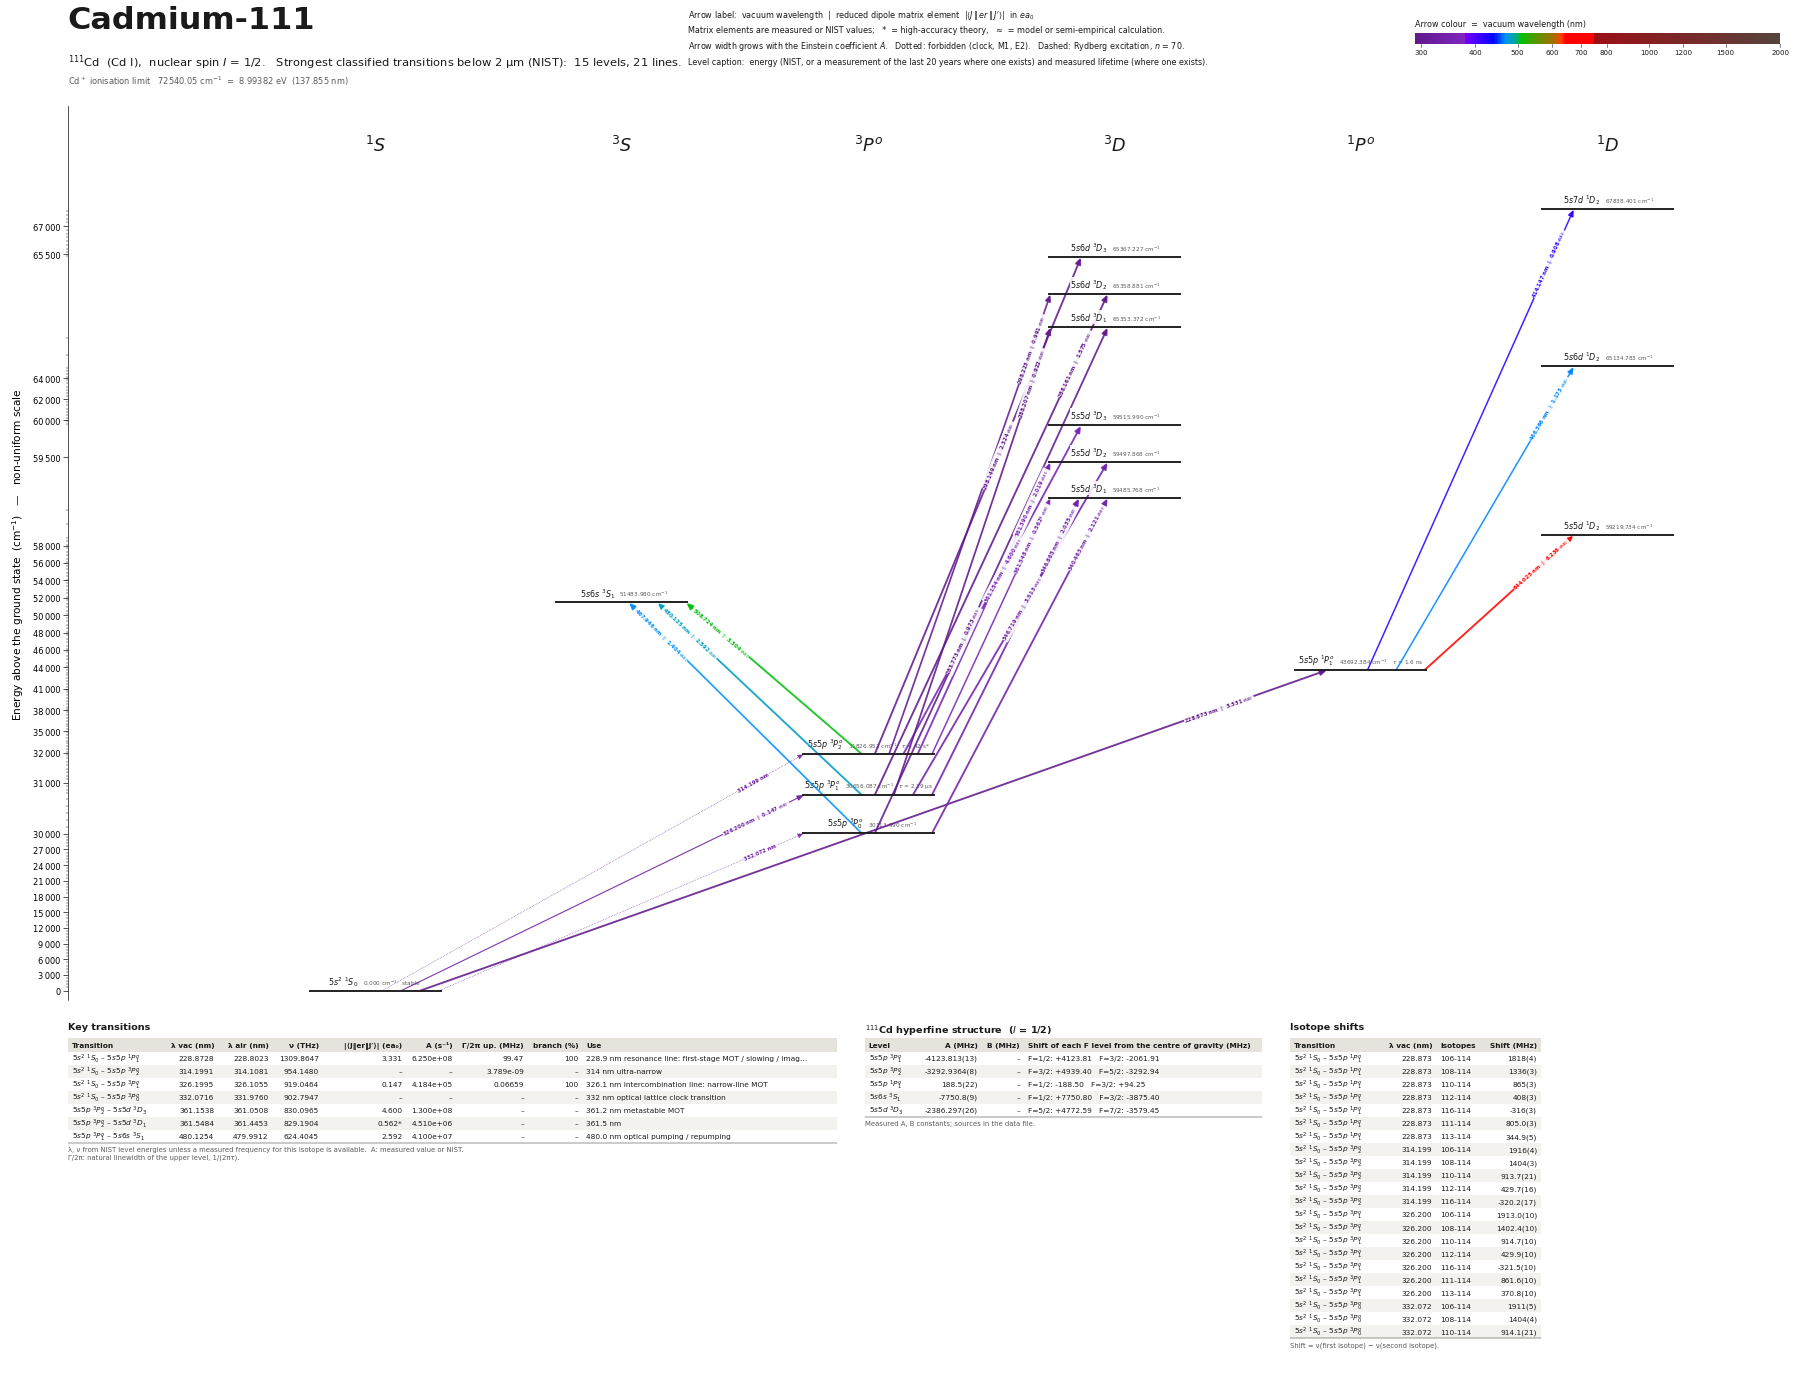 Cadmium-111 (111Cd)15 levels, 21 transitions below 2 µm
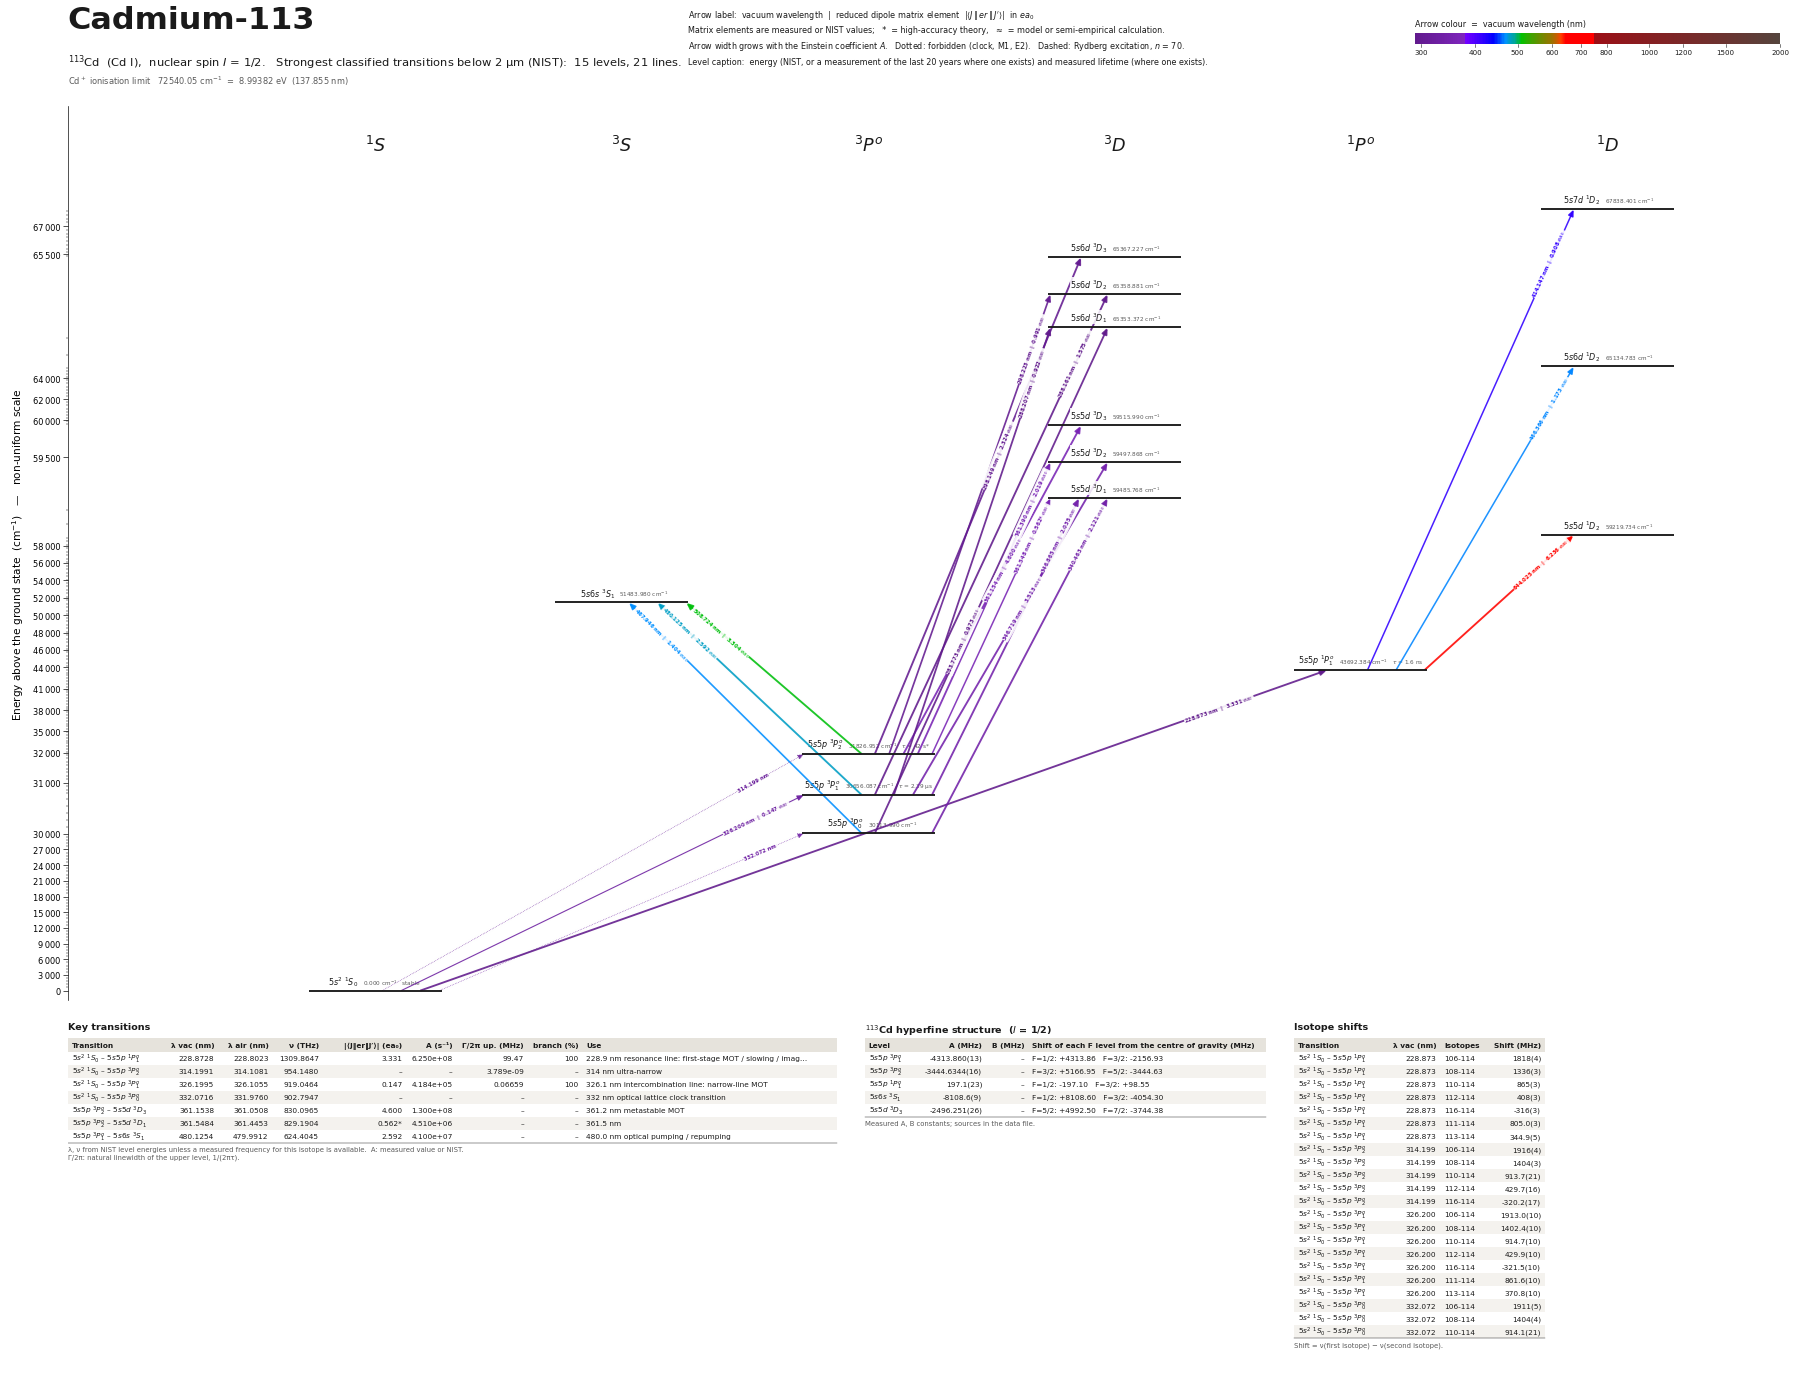 Cadmium-113 (113Cd)15 levels, 21 transitions below 2 µm
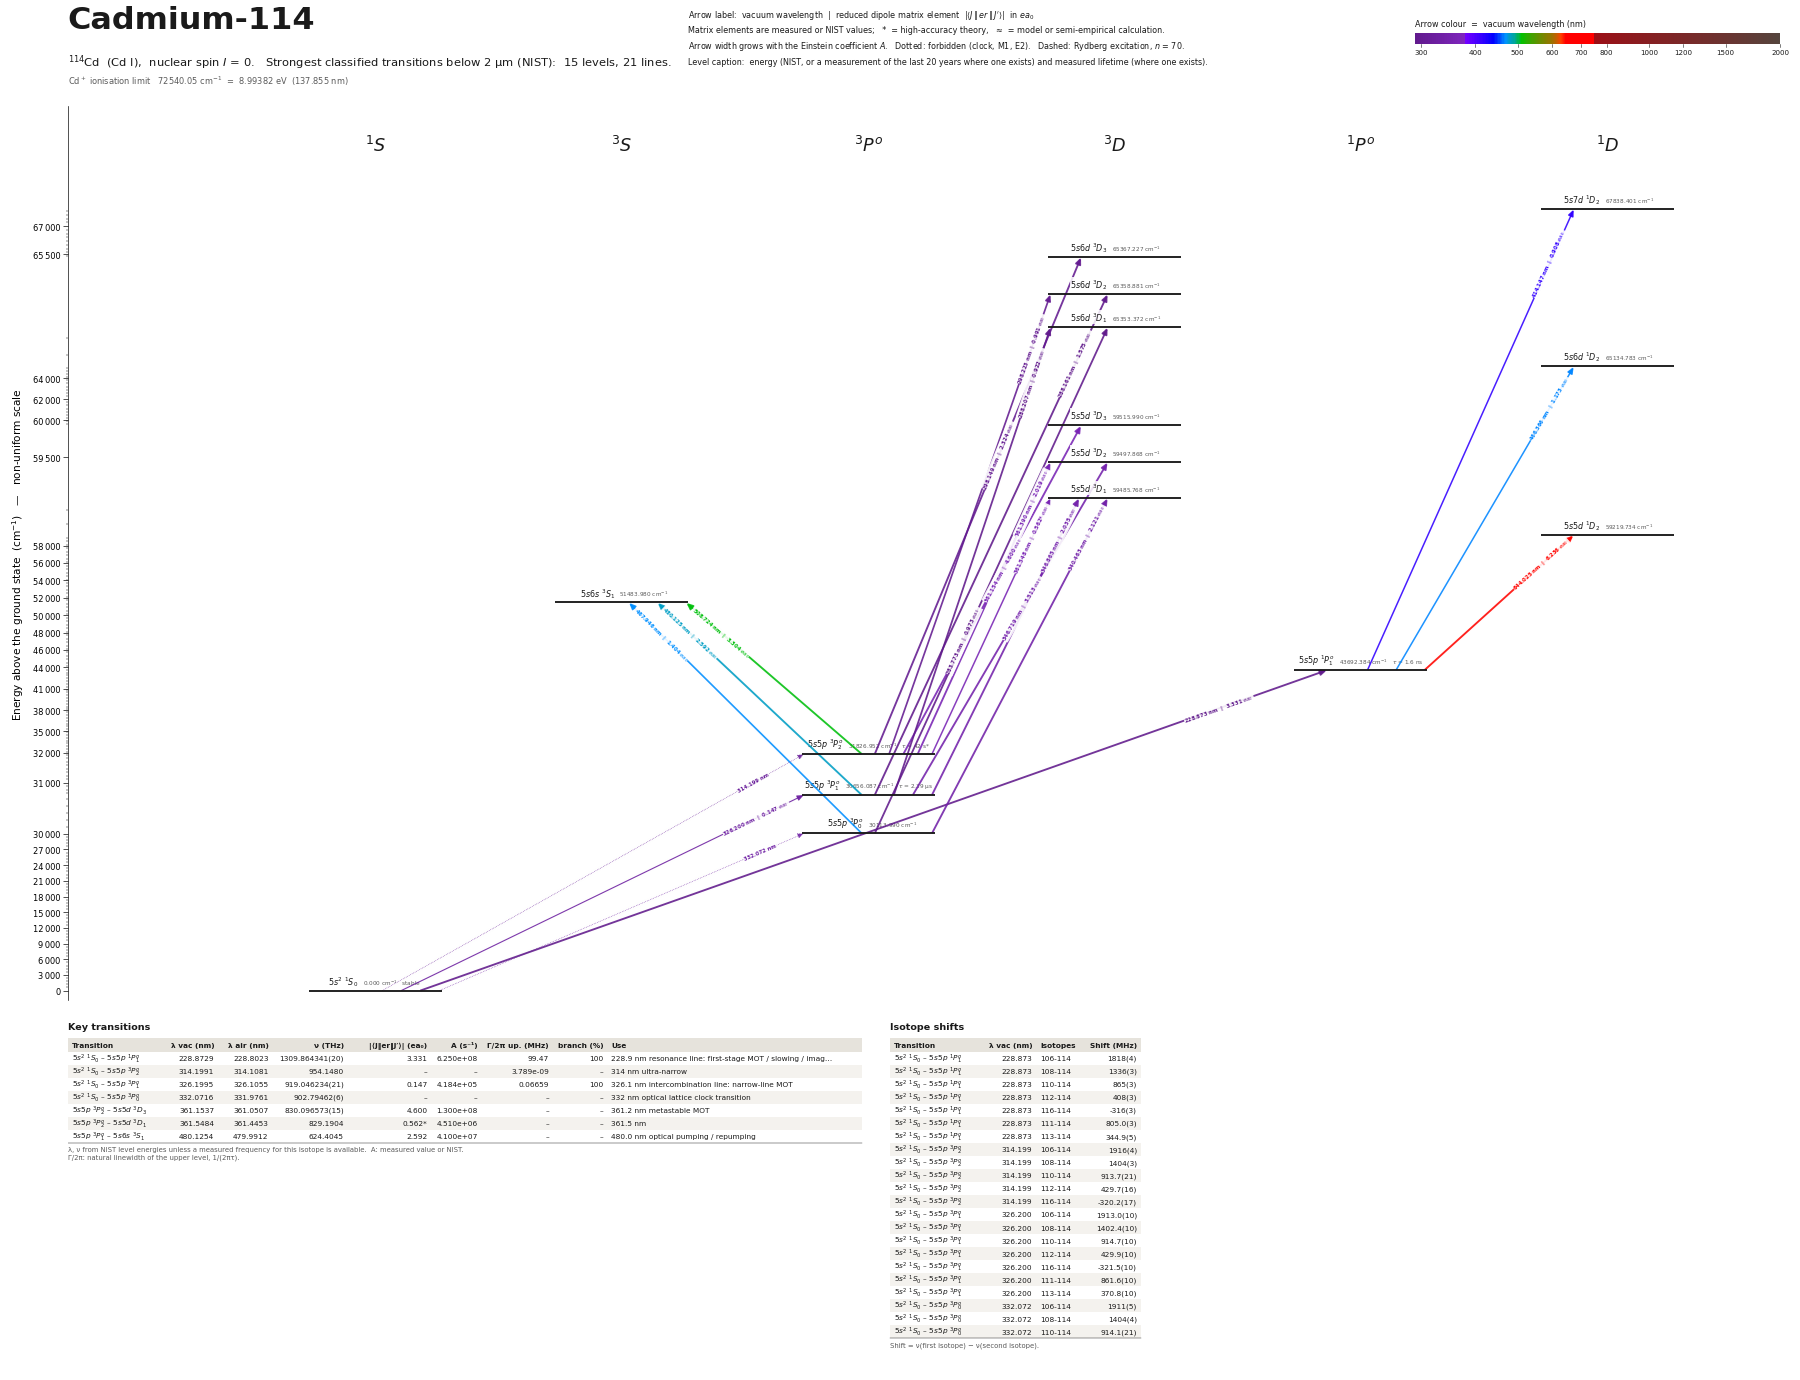 Cadmium-114 (114Cd)15 levels, 21 transitions below 2 µm
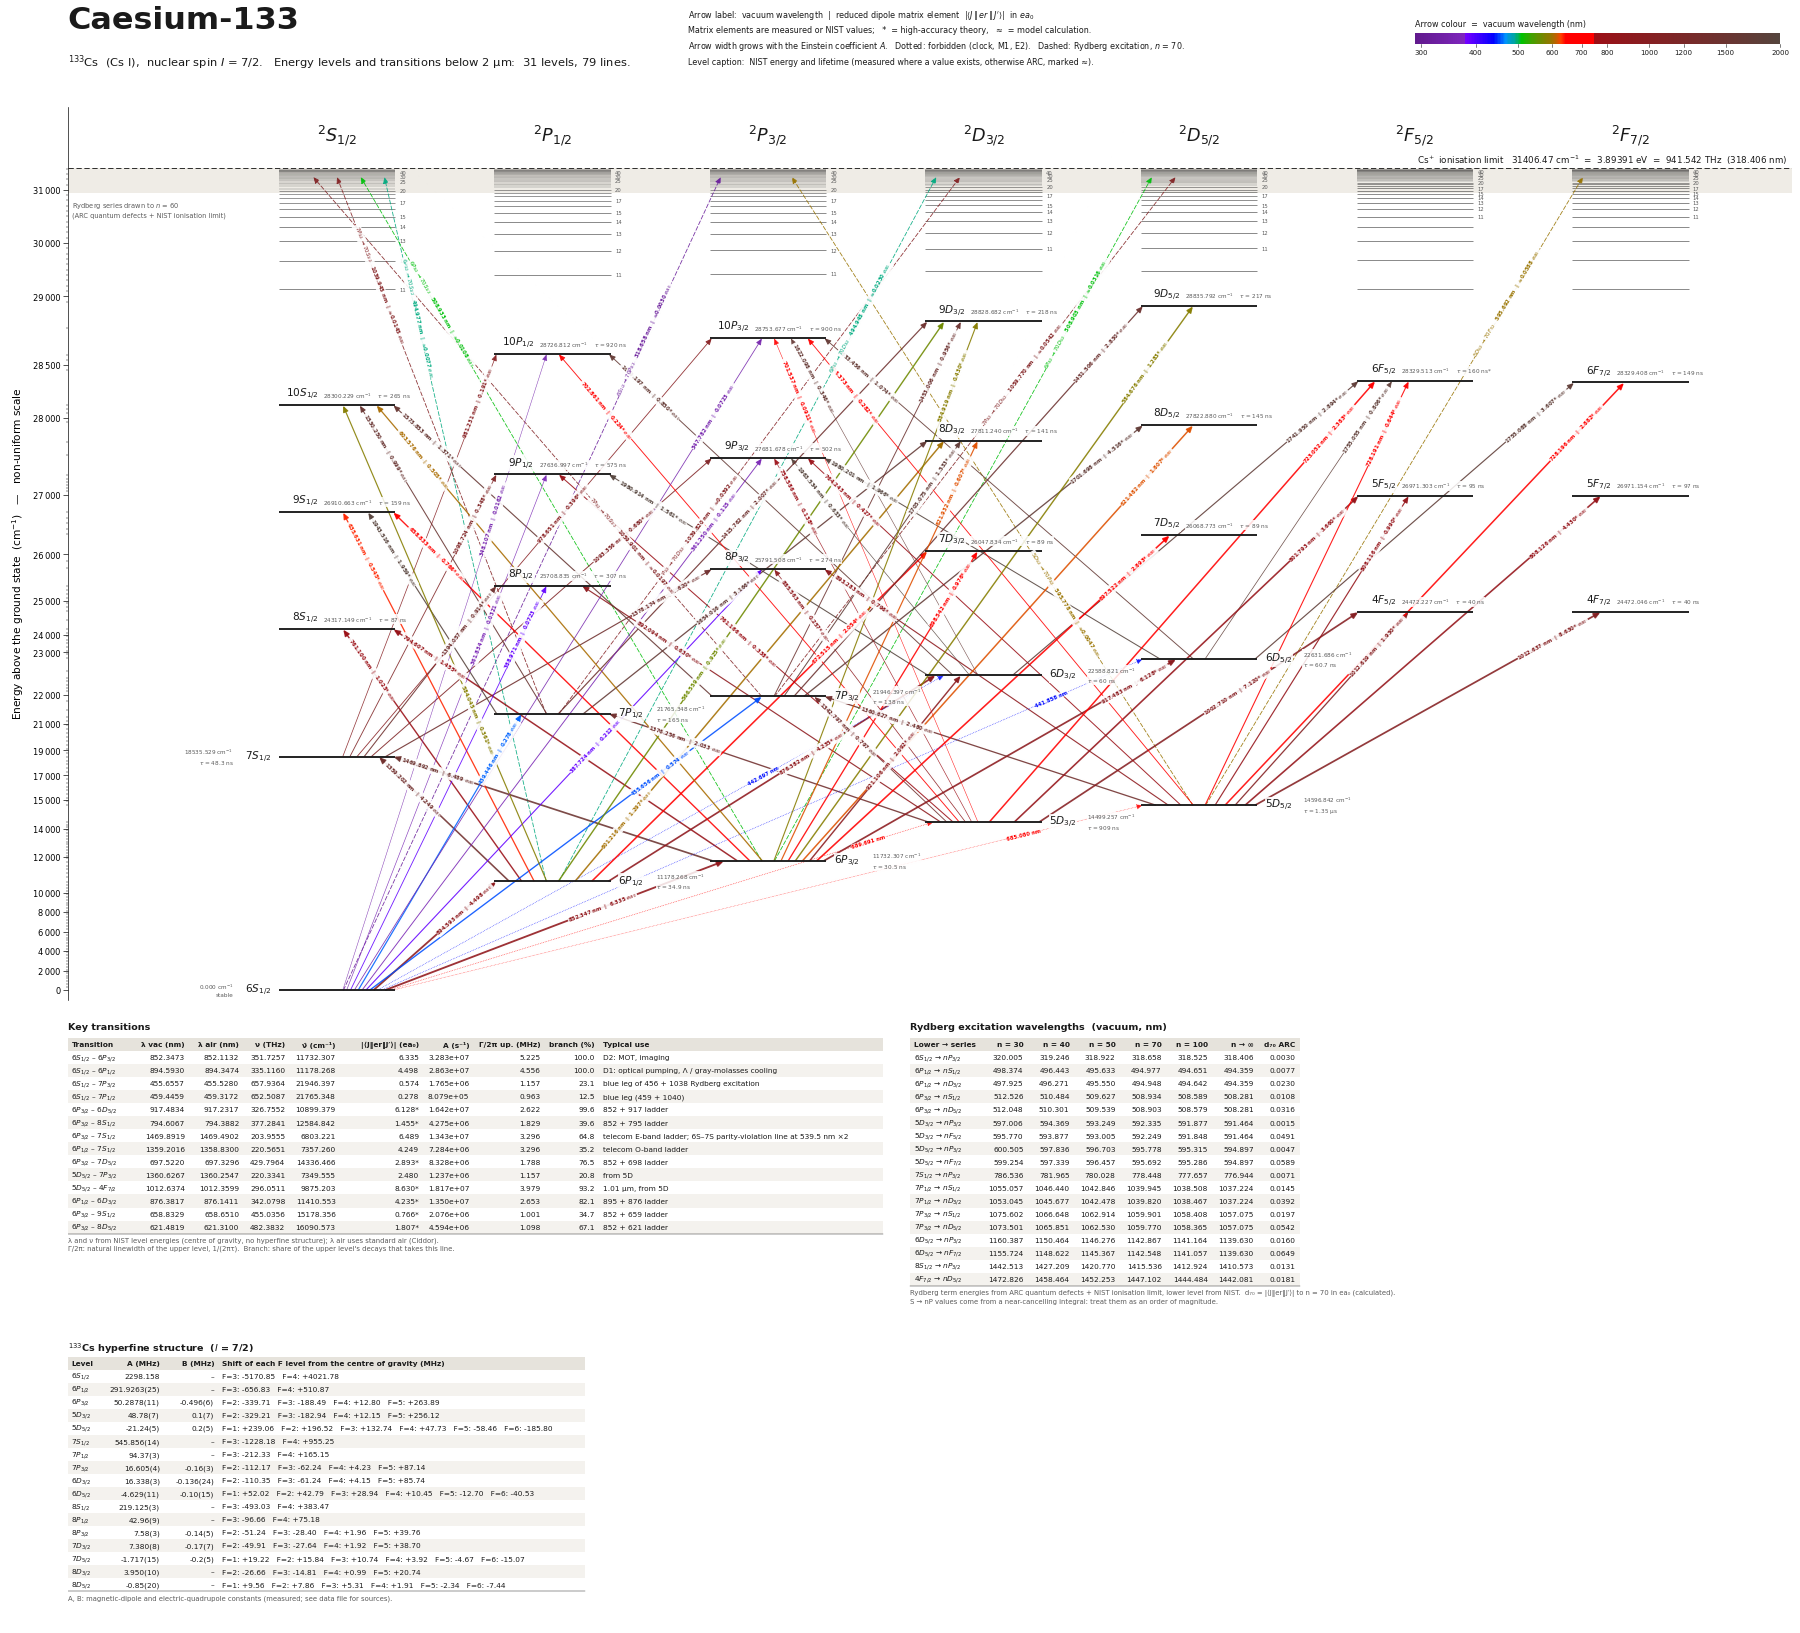 Caesium-133 (133Cs)31 levels, 79 transitions below 2 µm
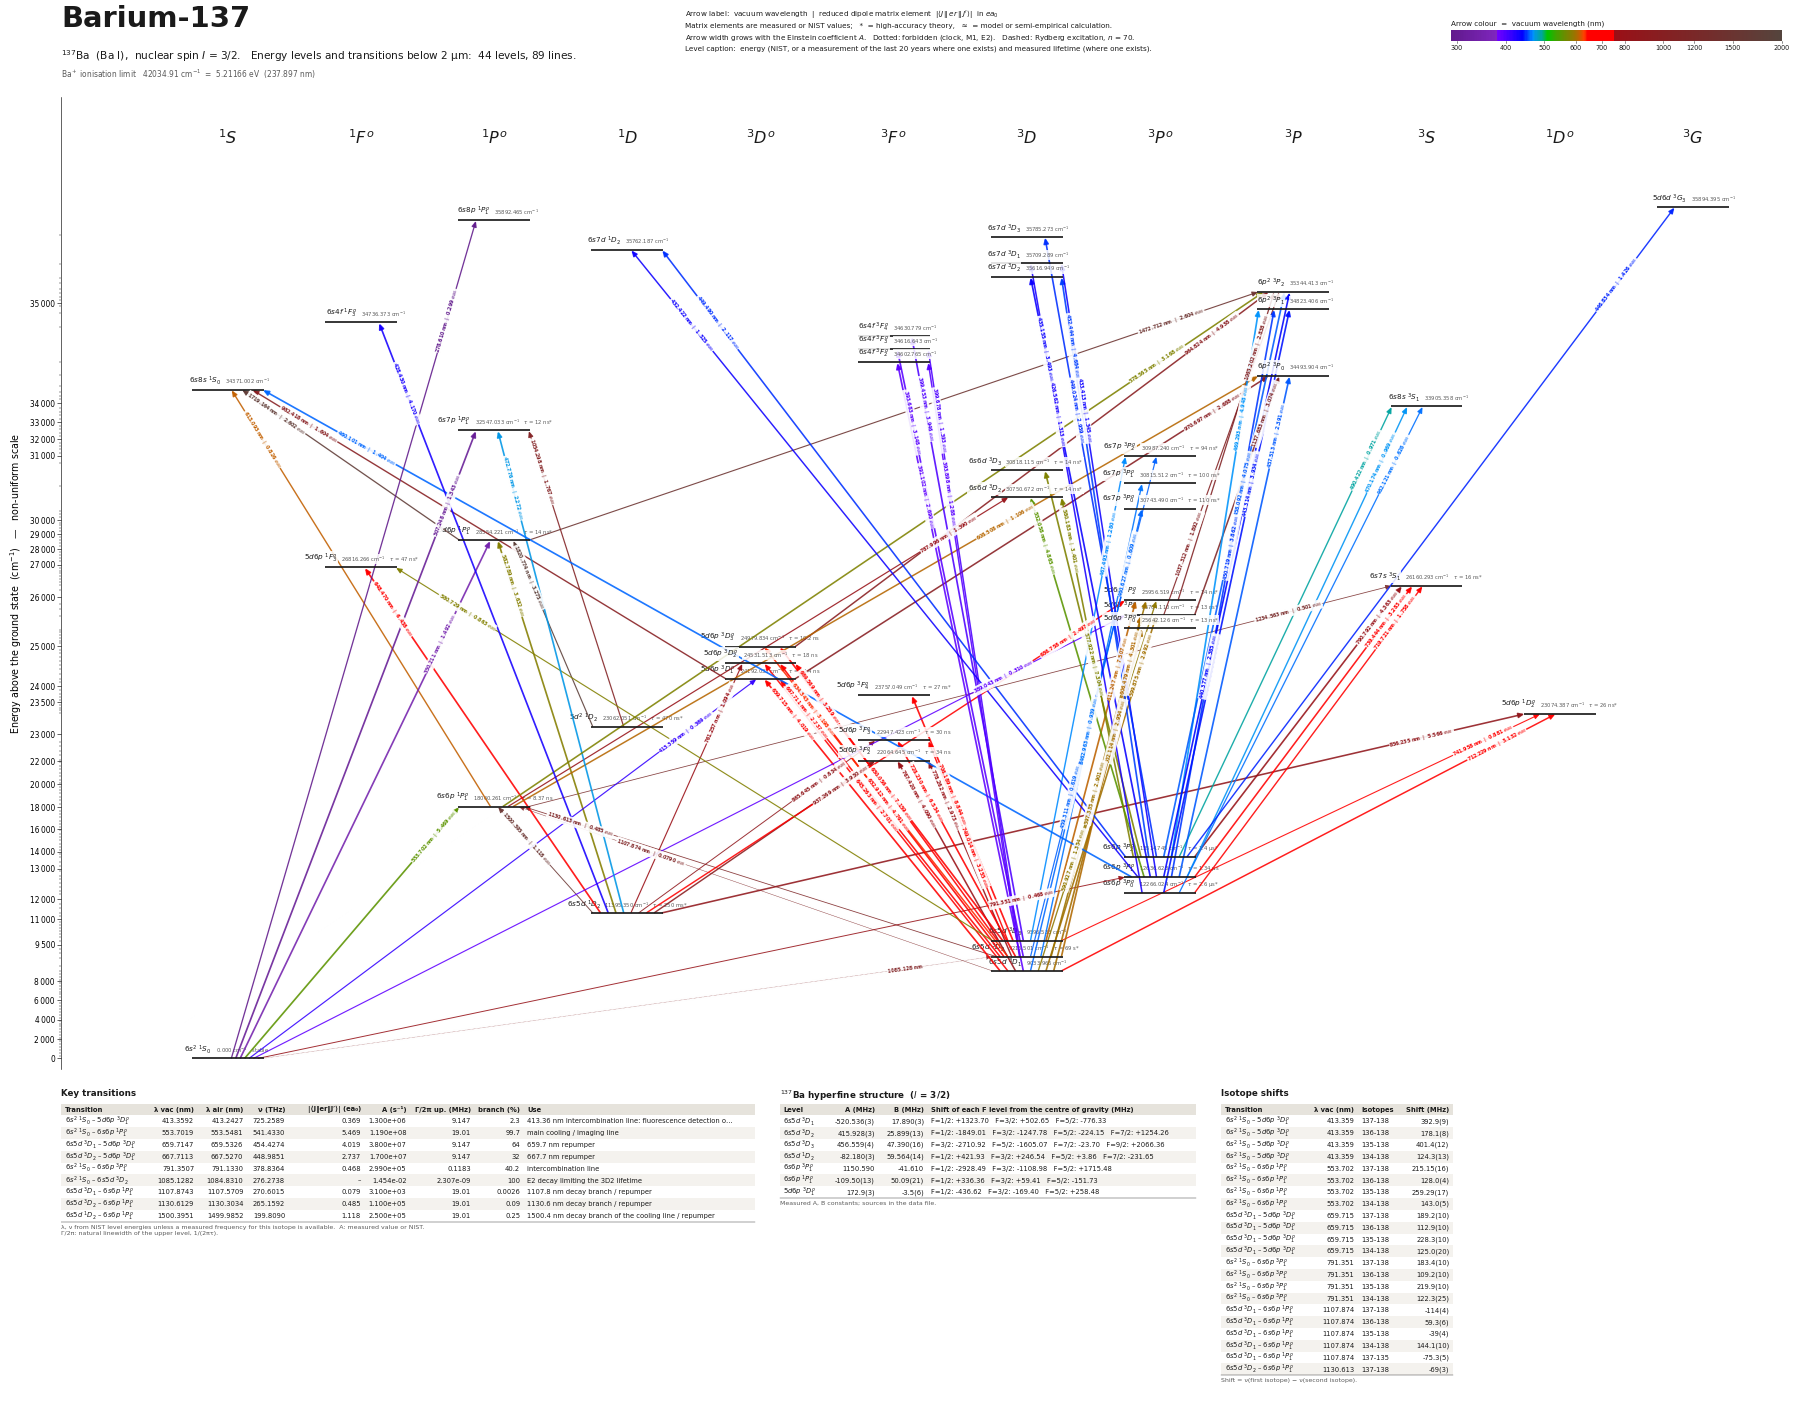 Barium-137 (137Ba)44 levels, 89 transitions below 2 µm
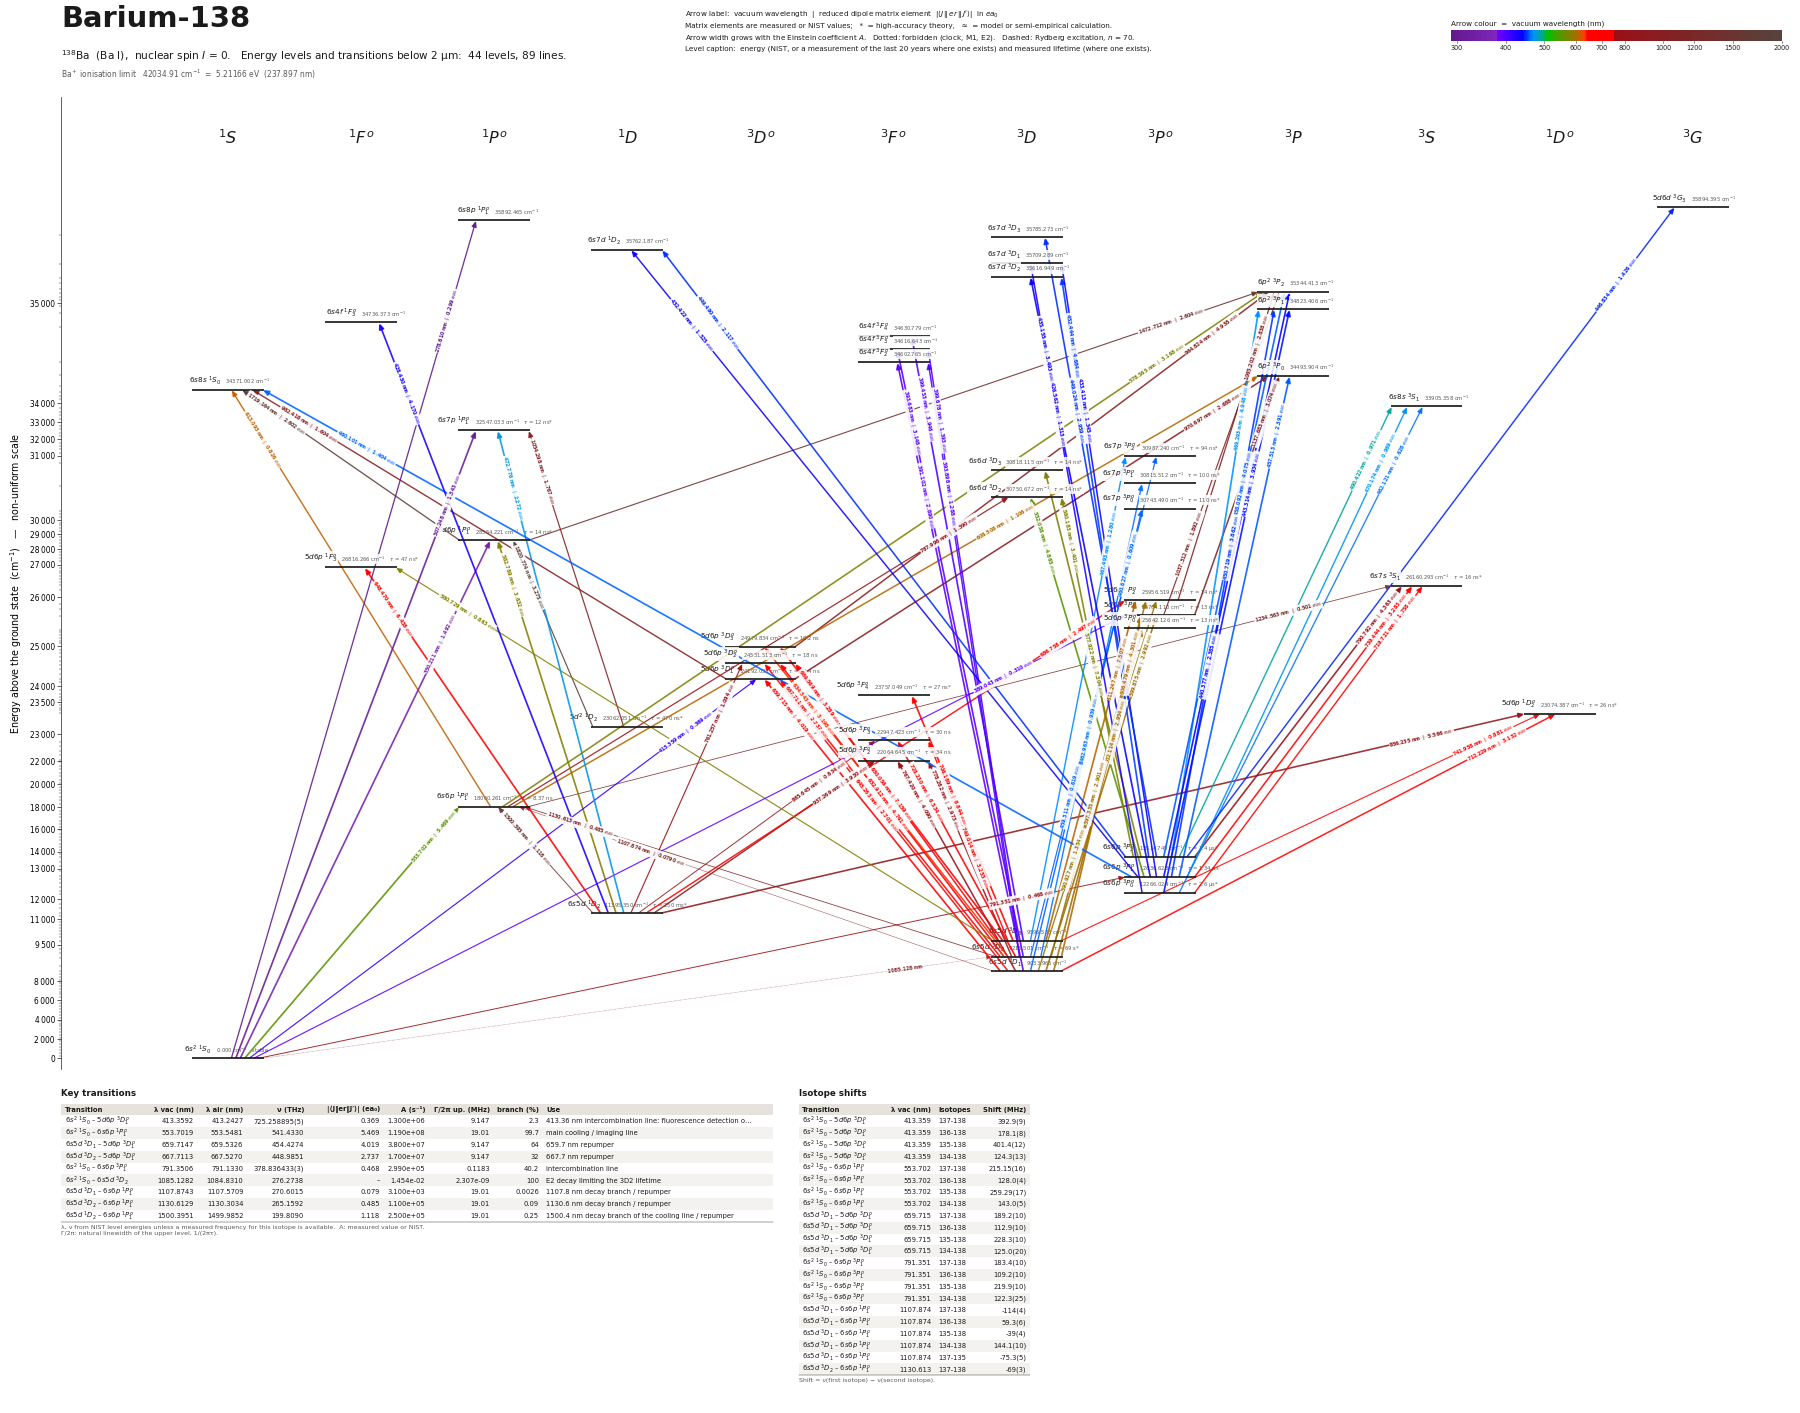 Barium-138 (138Ba)44 levels, 89 transitions below 2 µm
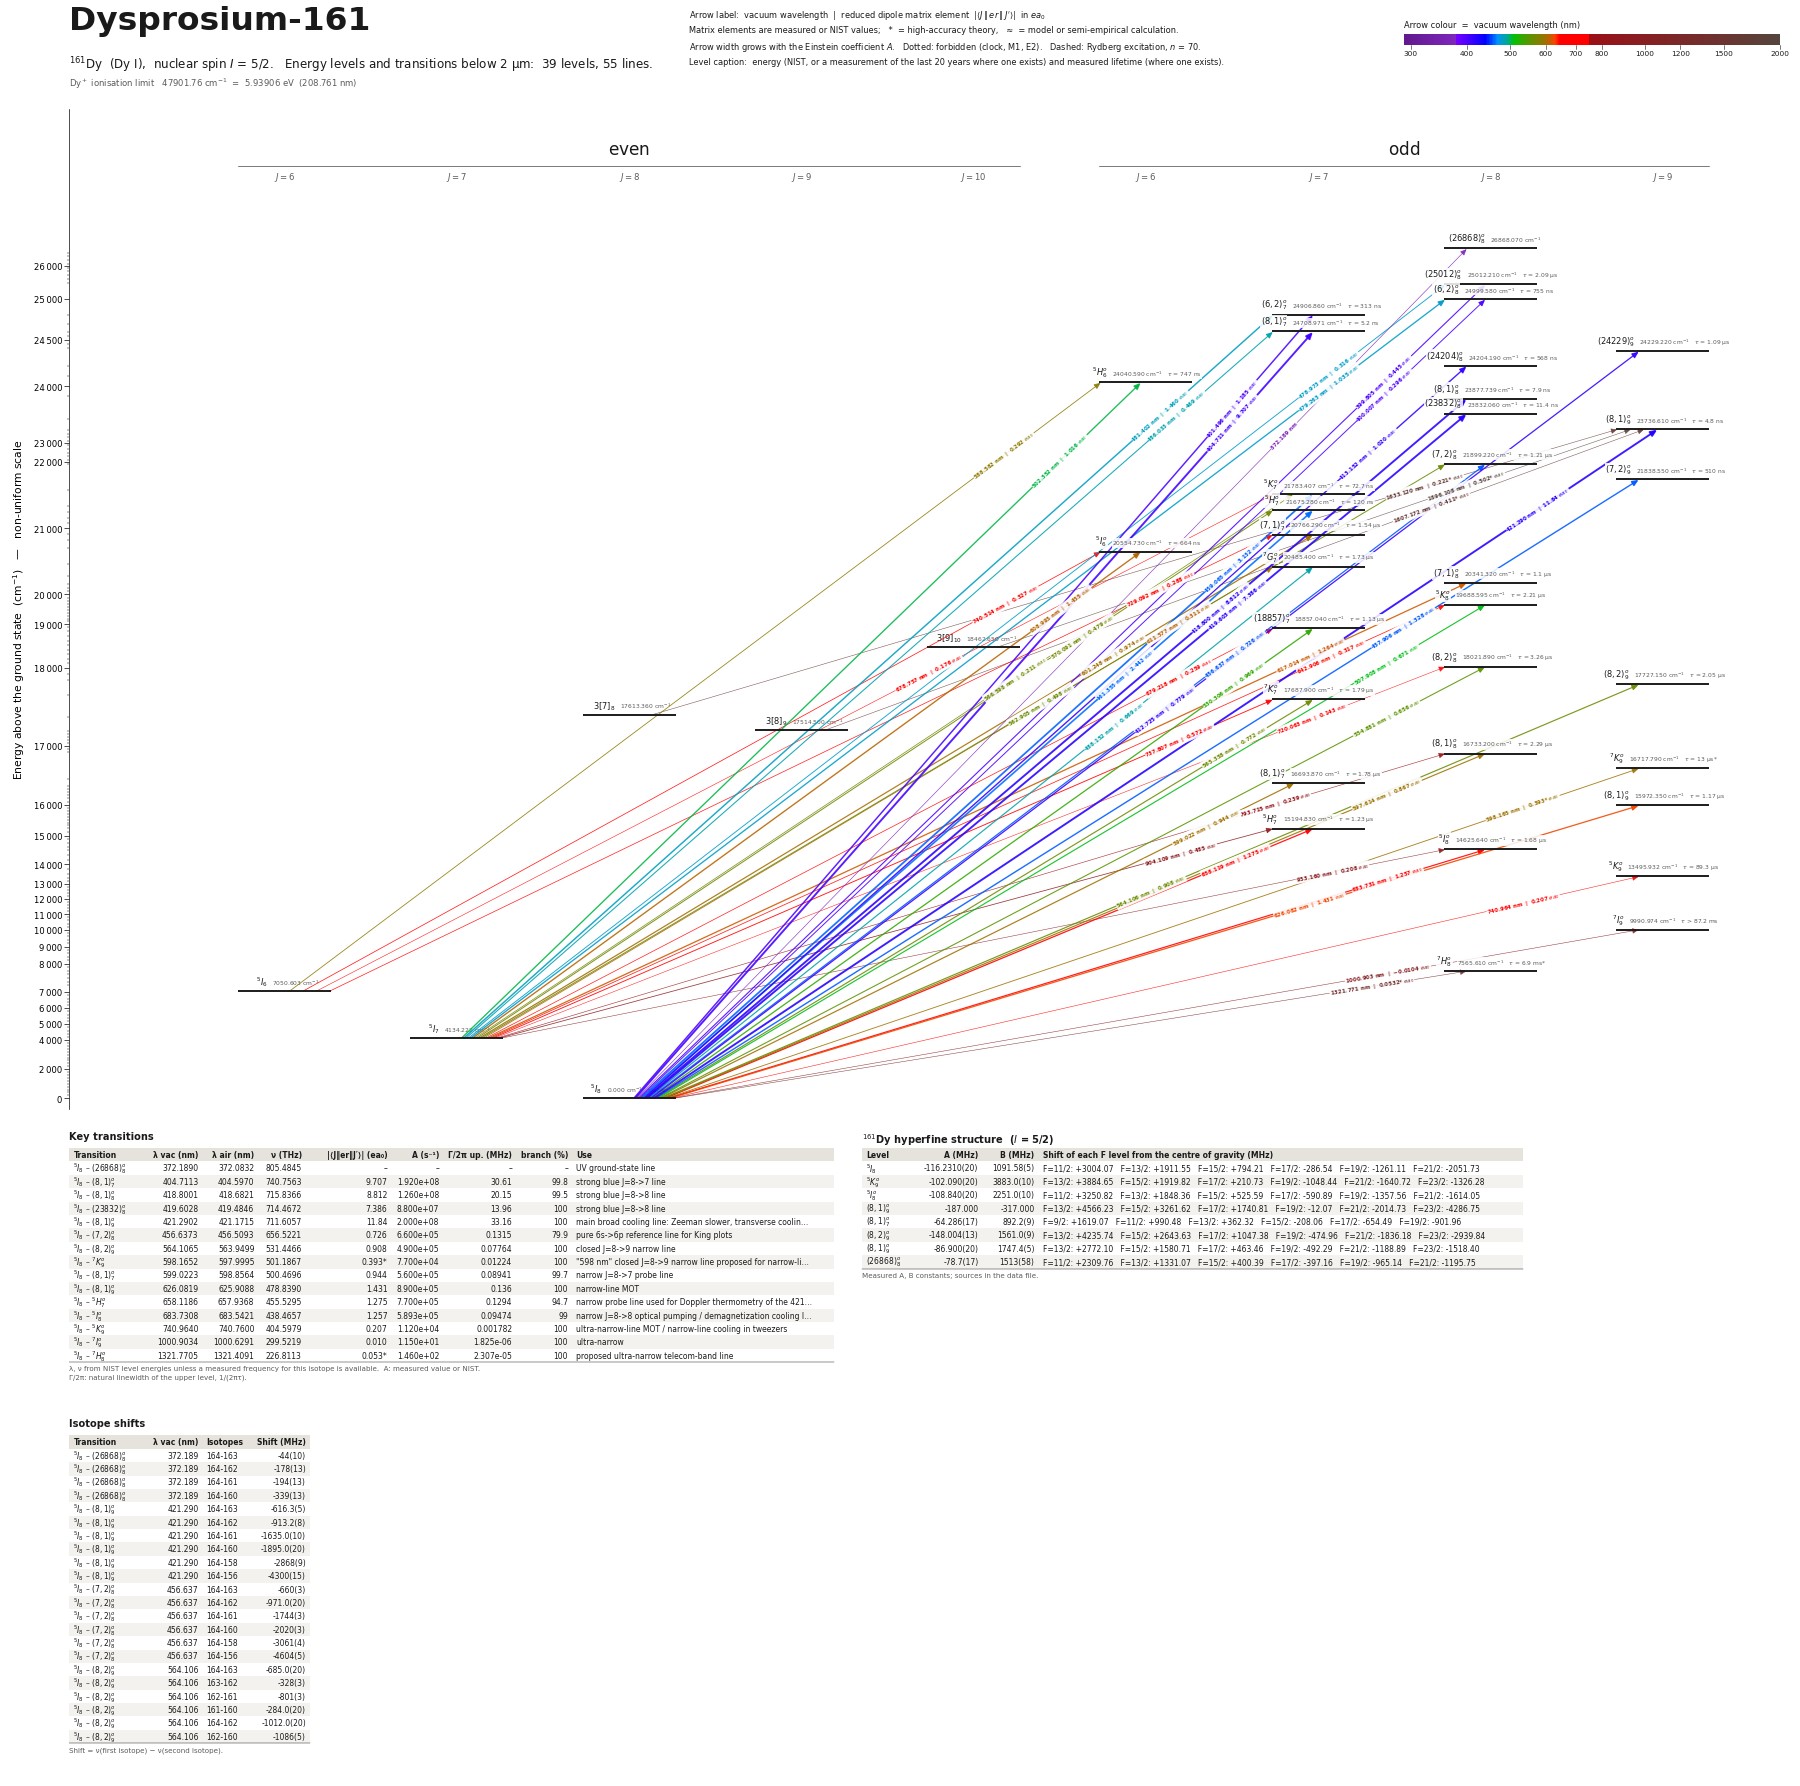 Dysprosium-161 (161Dy)39 levels, 55 transitions below 2 µm
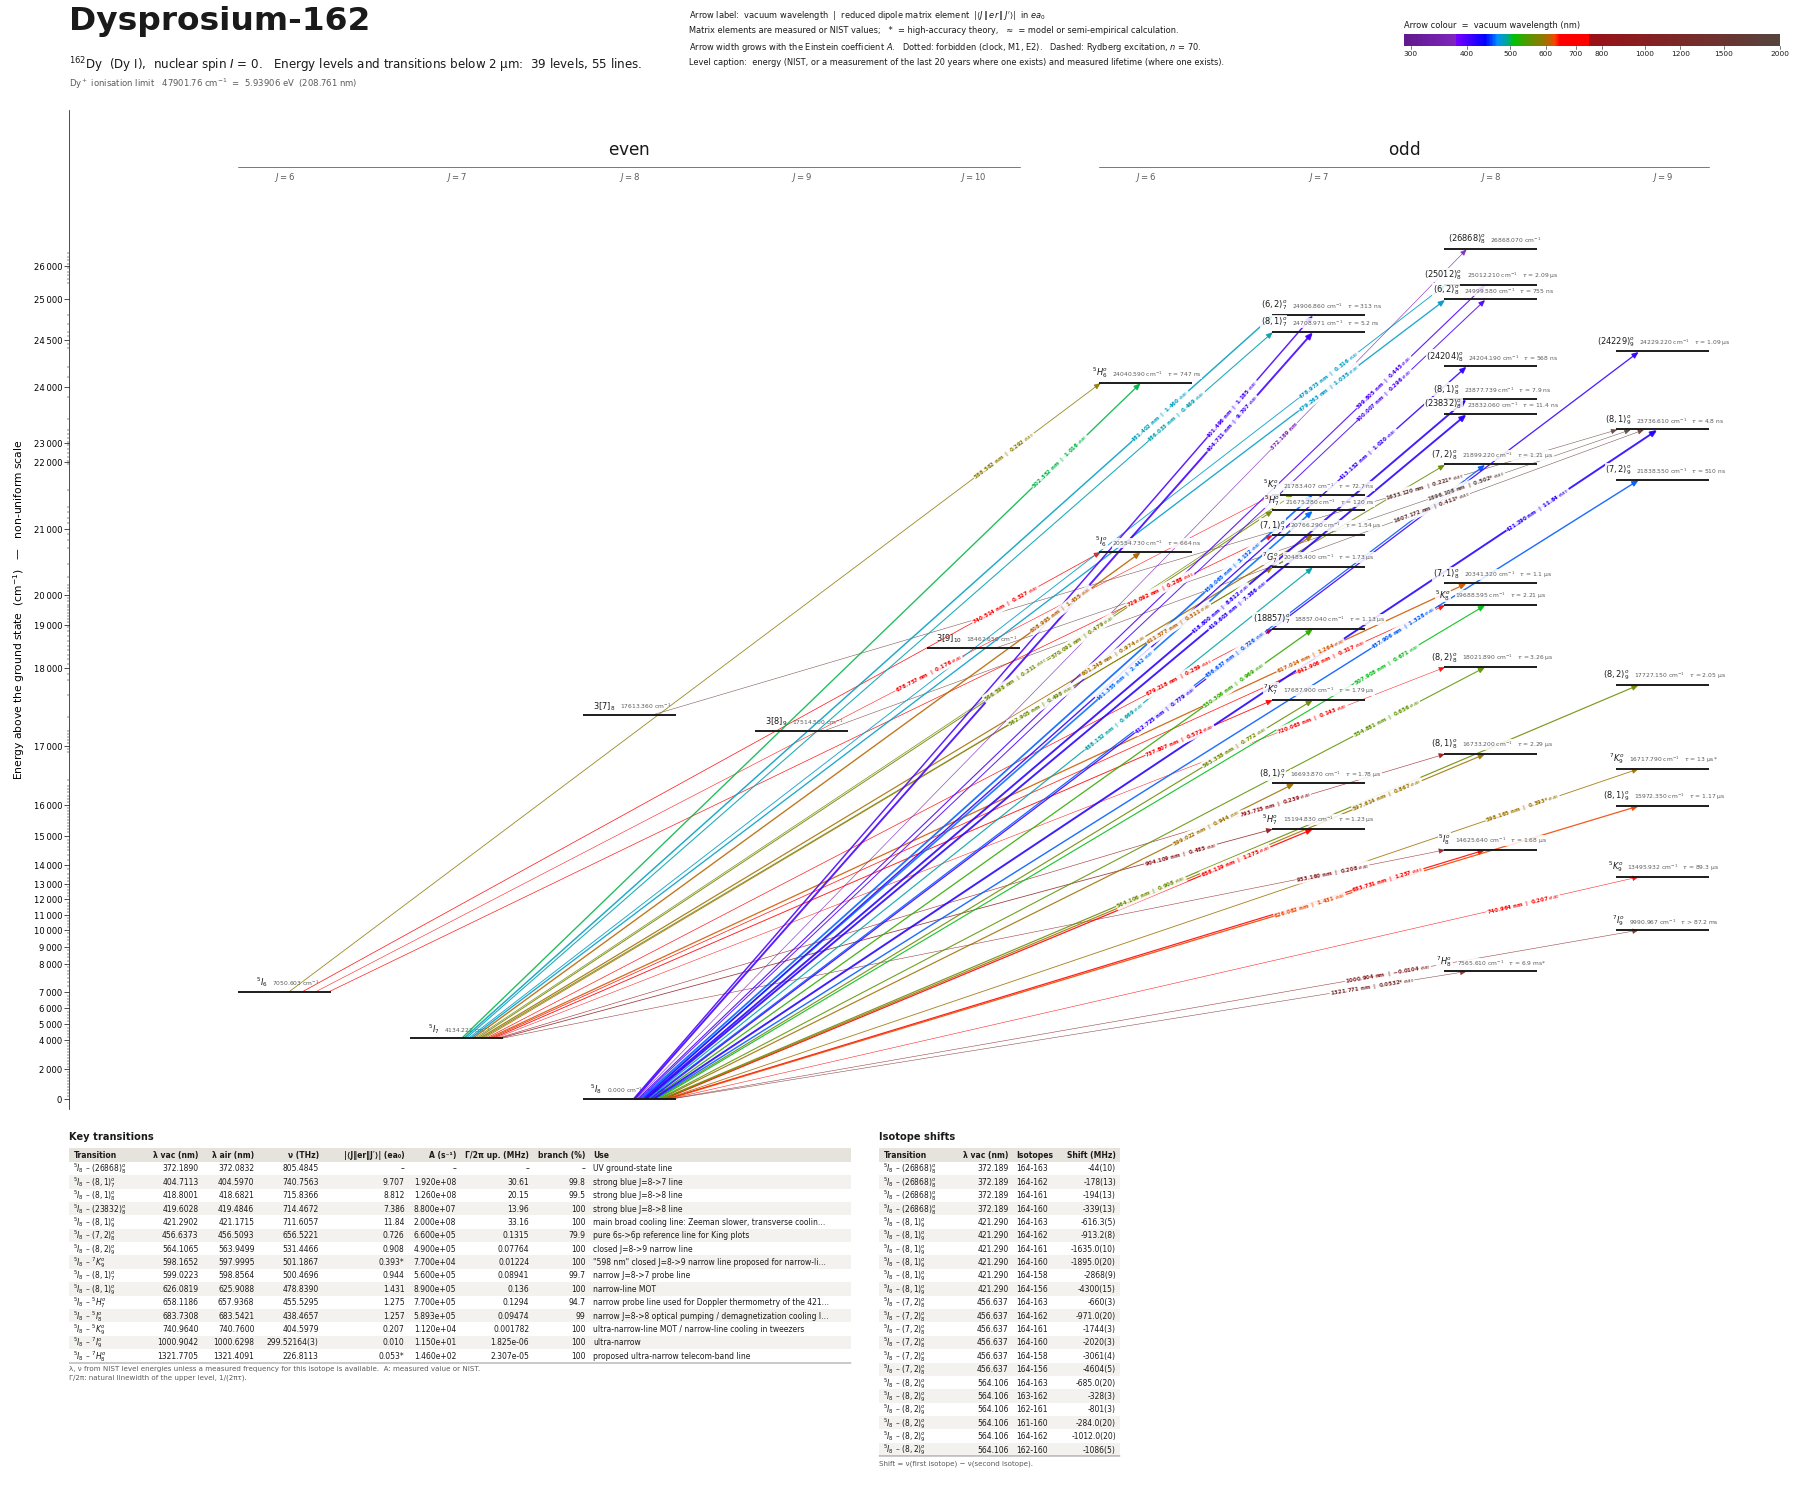 Dysprosium-162 (162Dy)39 levels, 55 transitions below 2 µm
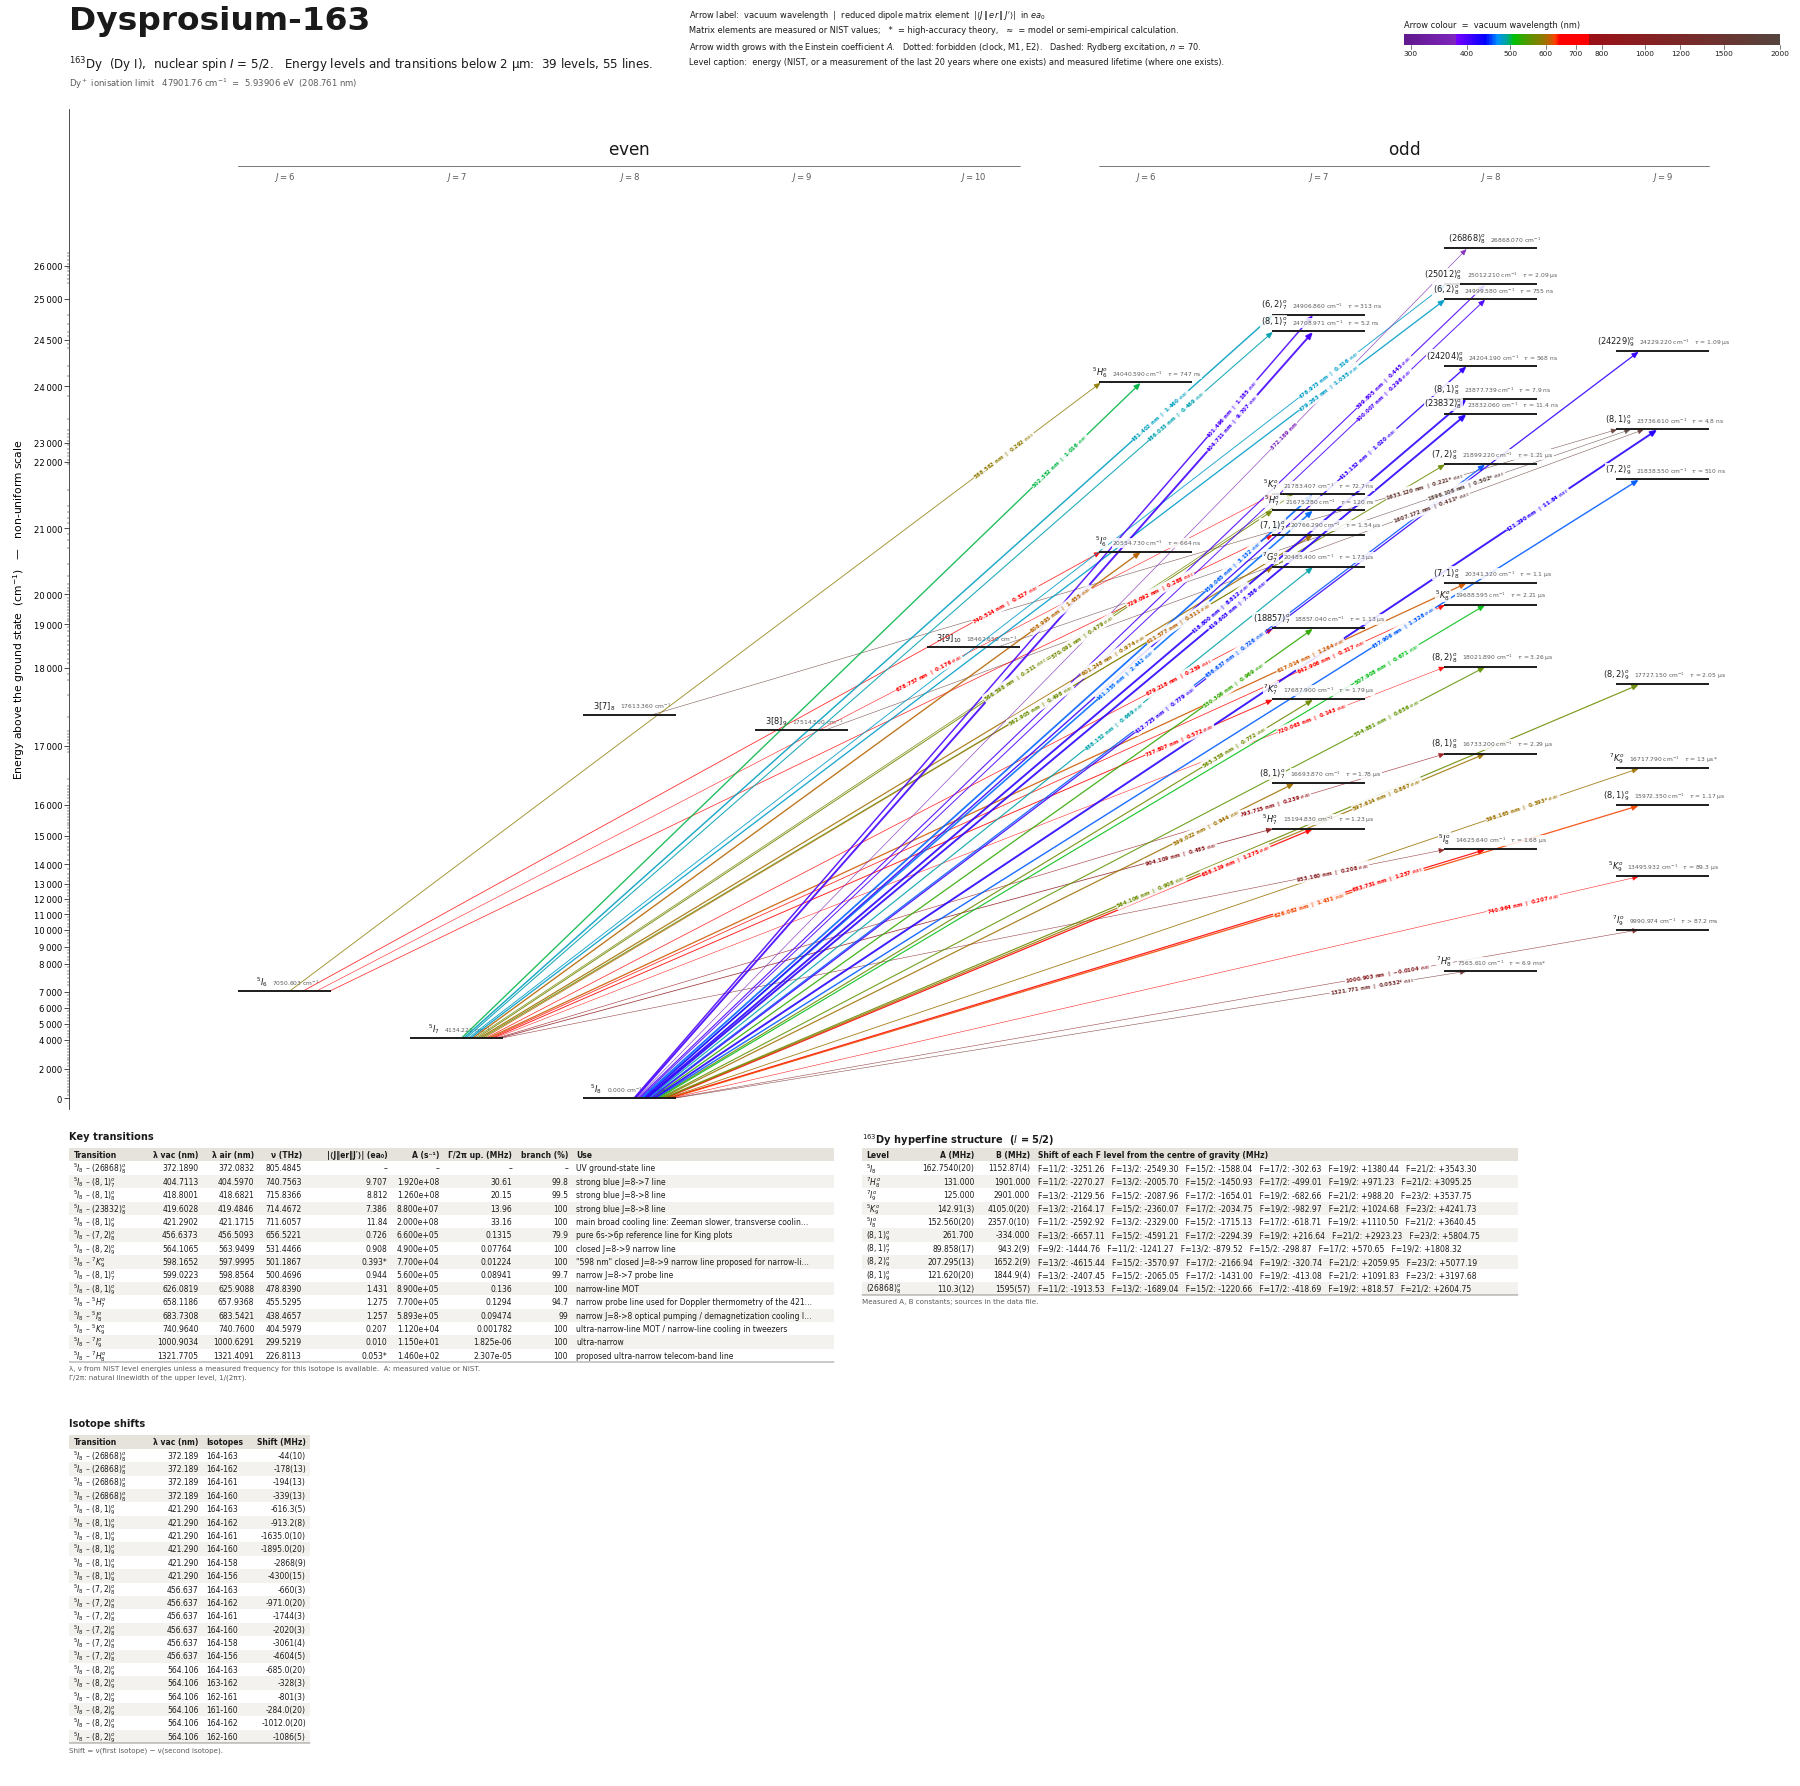 Dysprosium-163 (163Dy)39 levels, 55 transitions below 2 µm
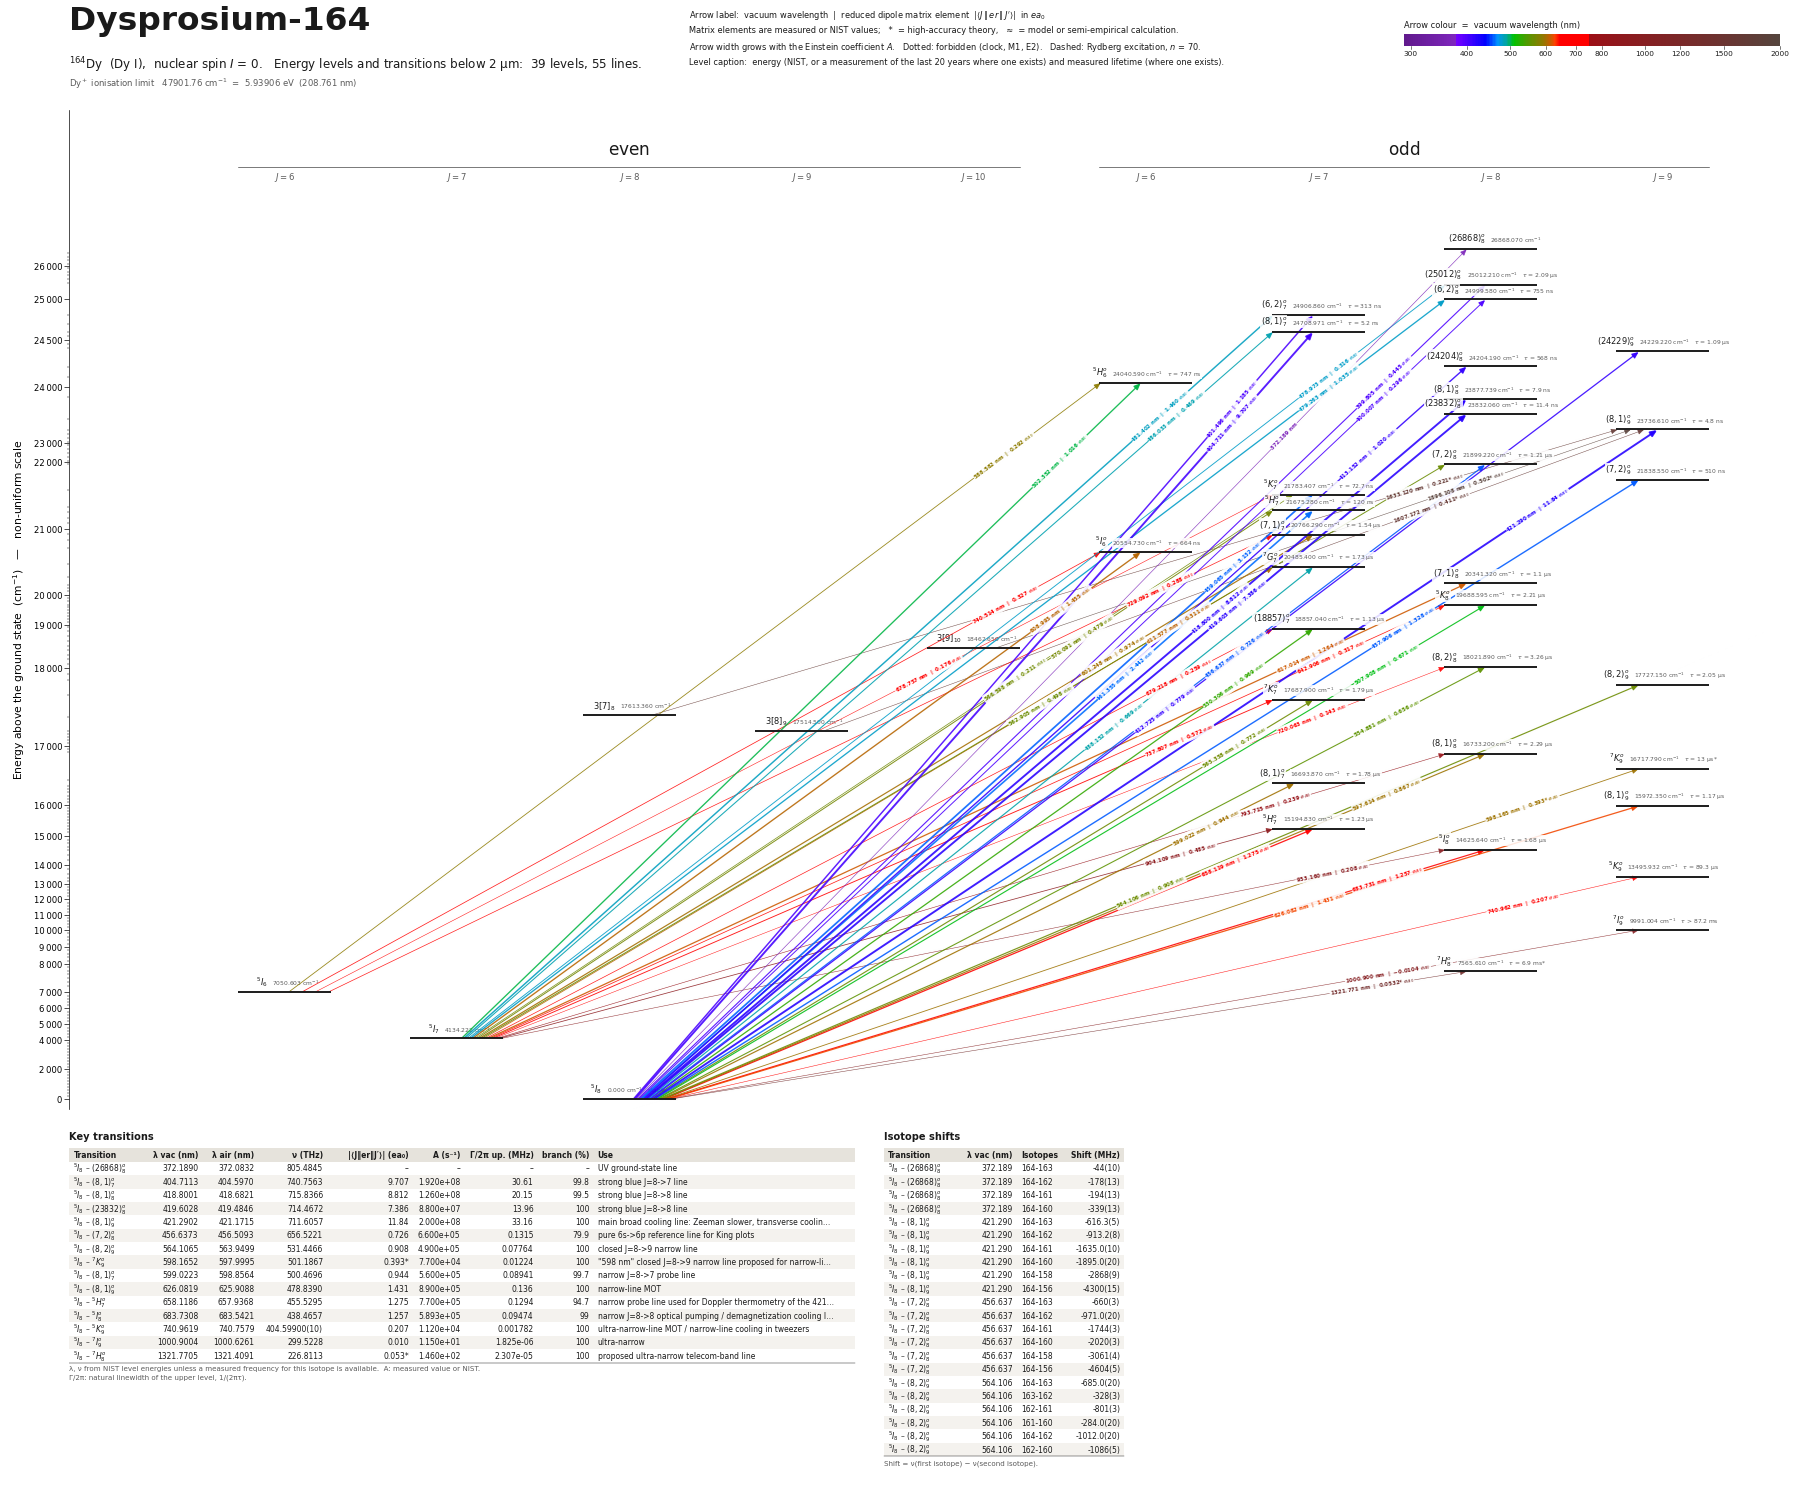 Dysprosium-164 (164Dy)39 levels, 55 transitions below 2 µm
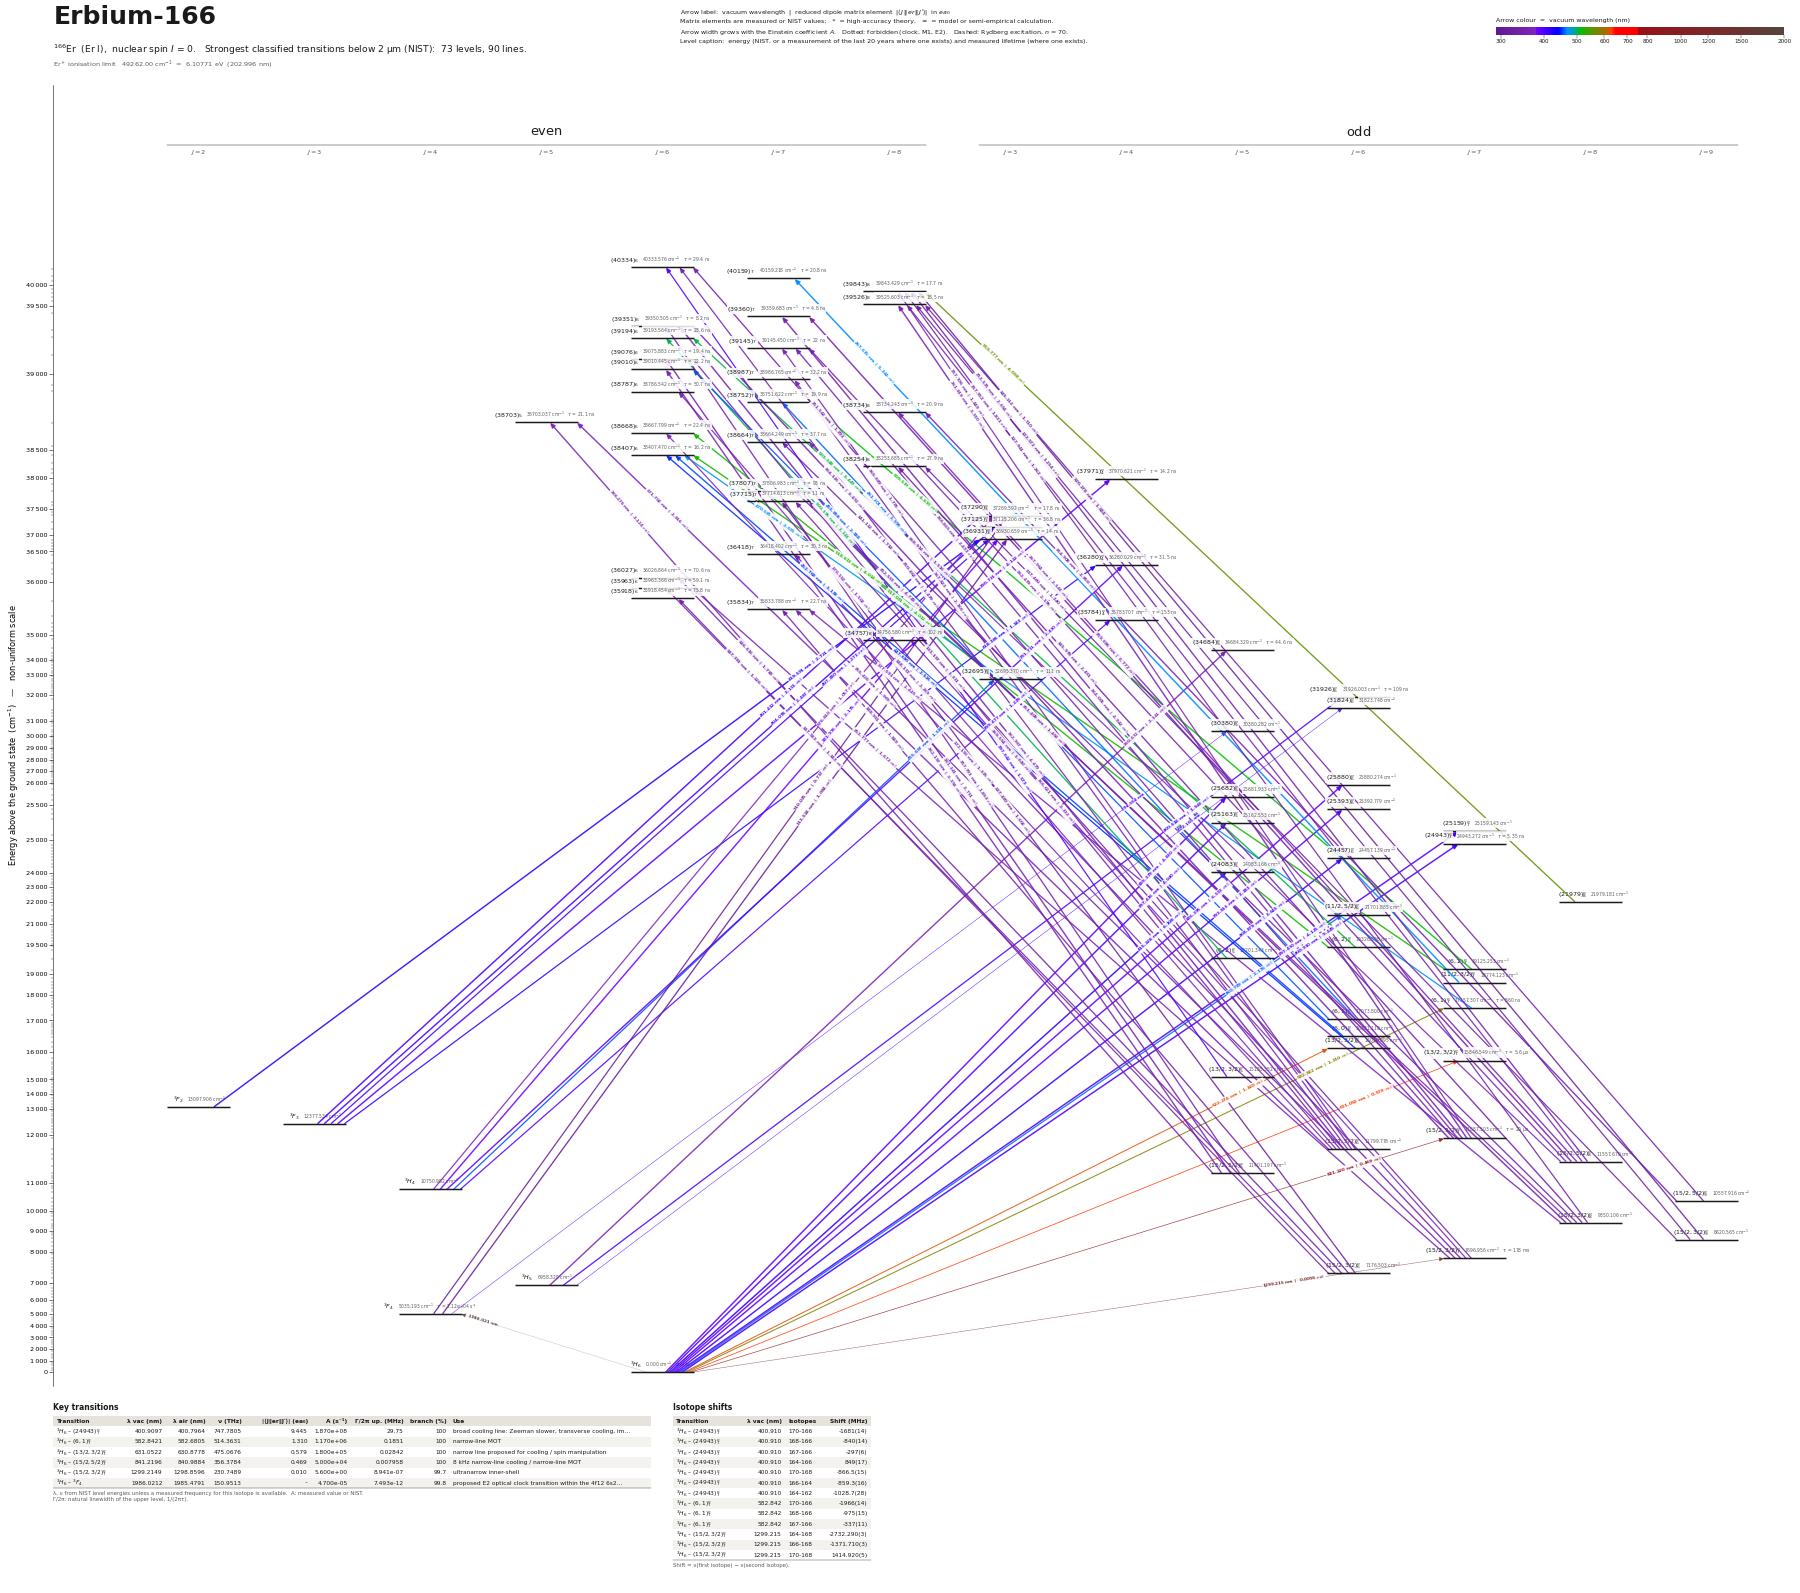 Erbium-166 (166Er)73 levels, 90 transitions below 2 µm
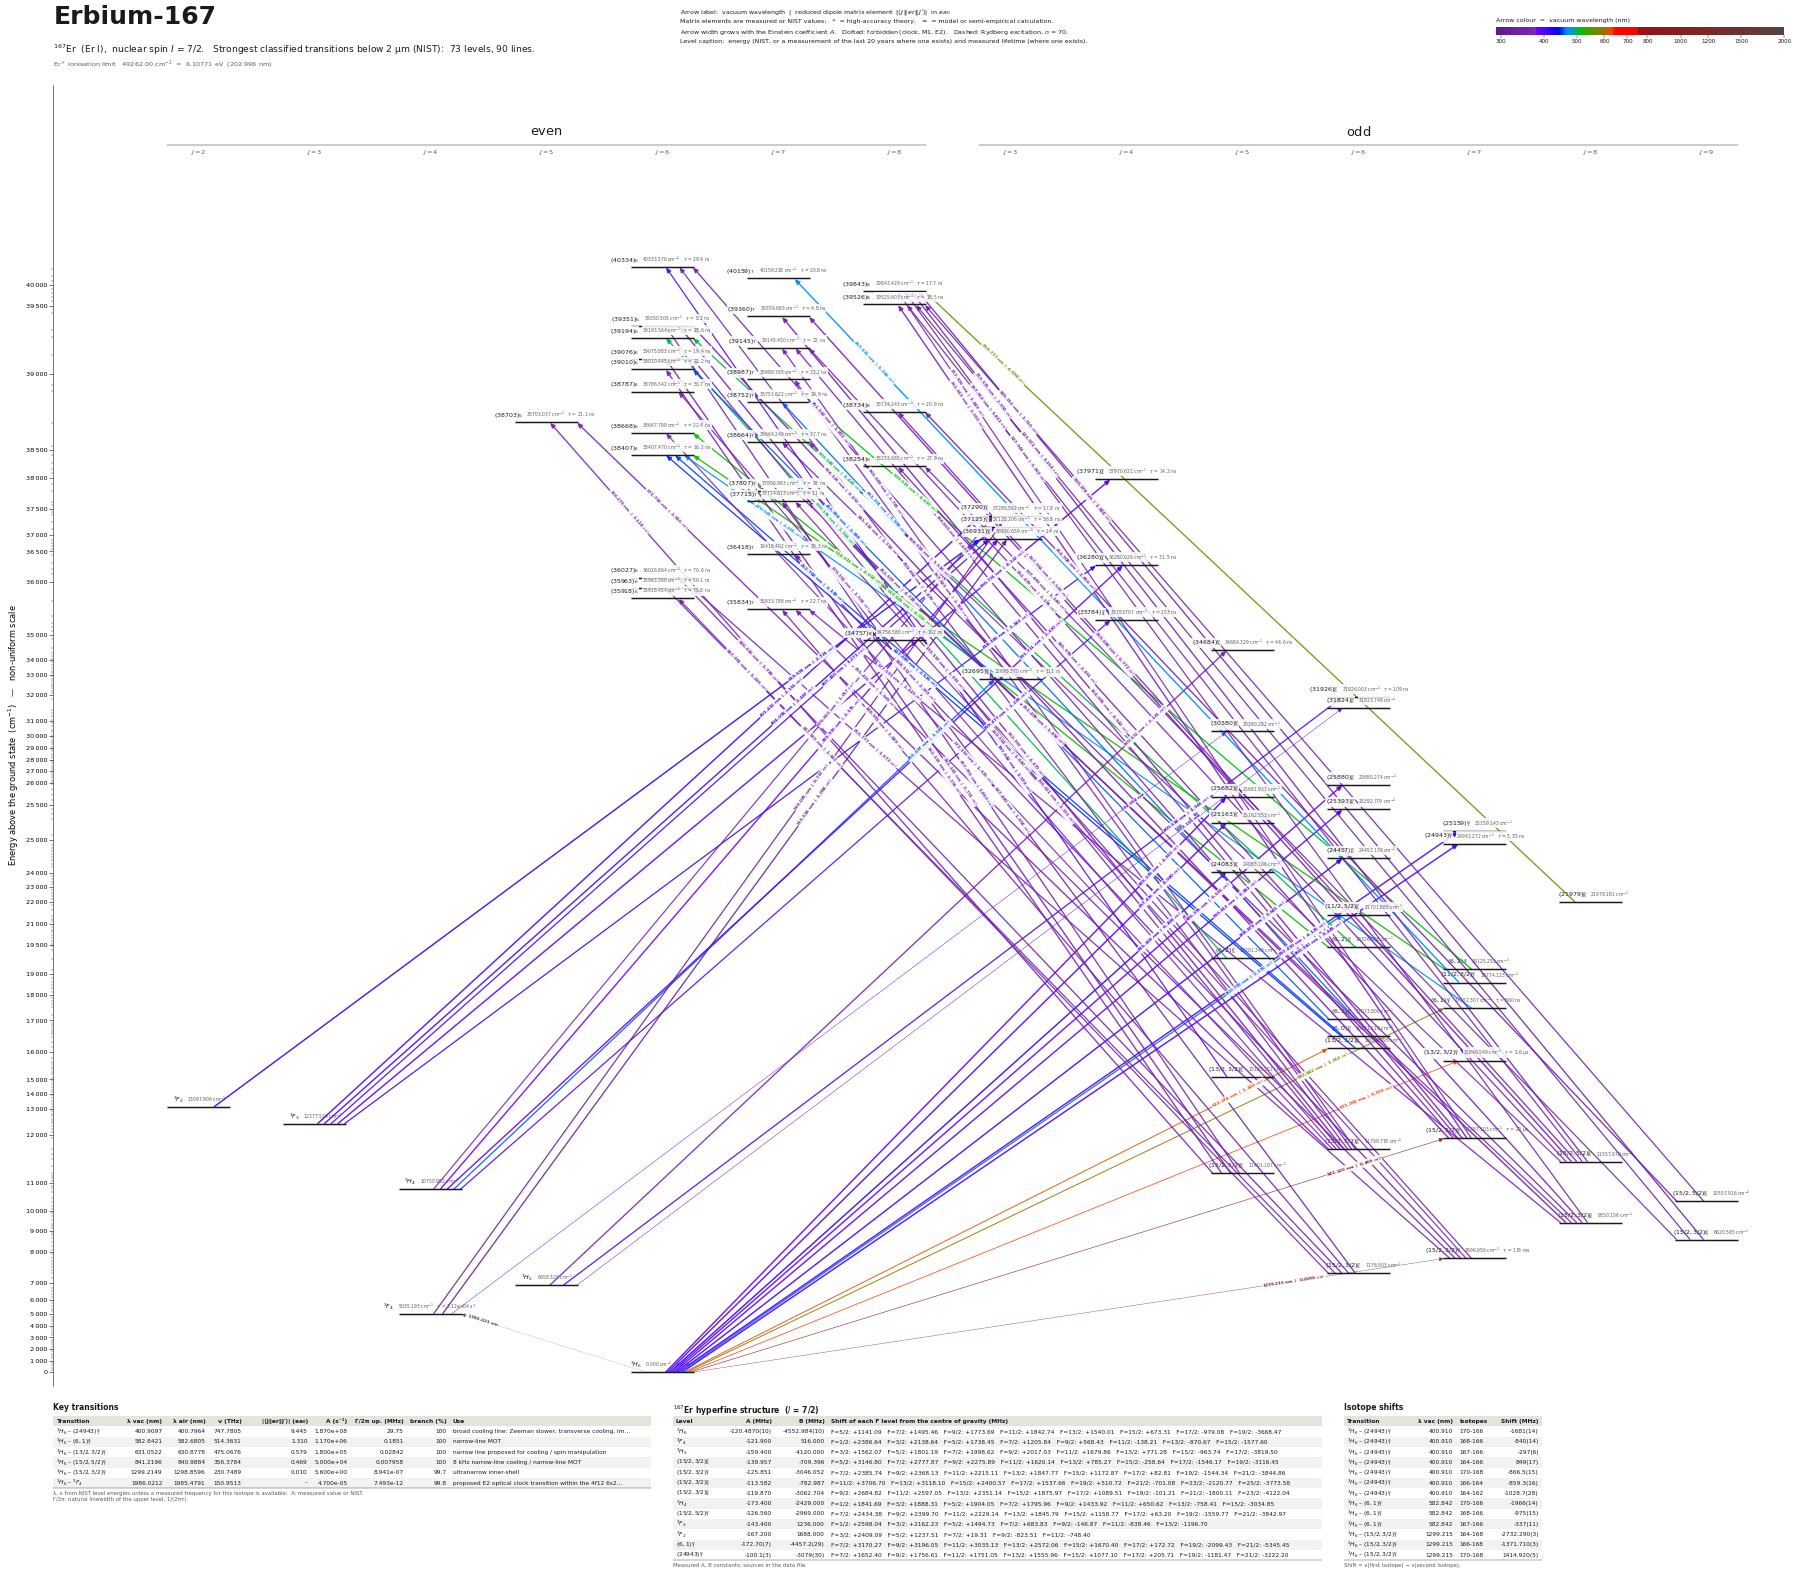 Erbium-167 (167Er)73 levels, 90 transitions below 2 µm
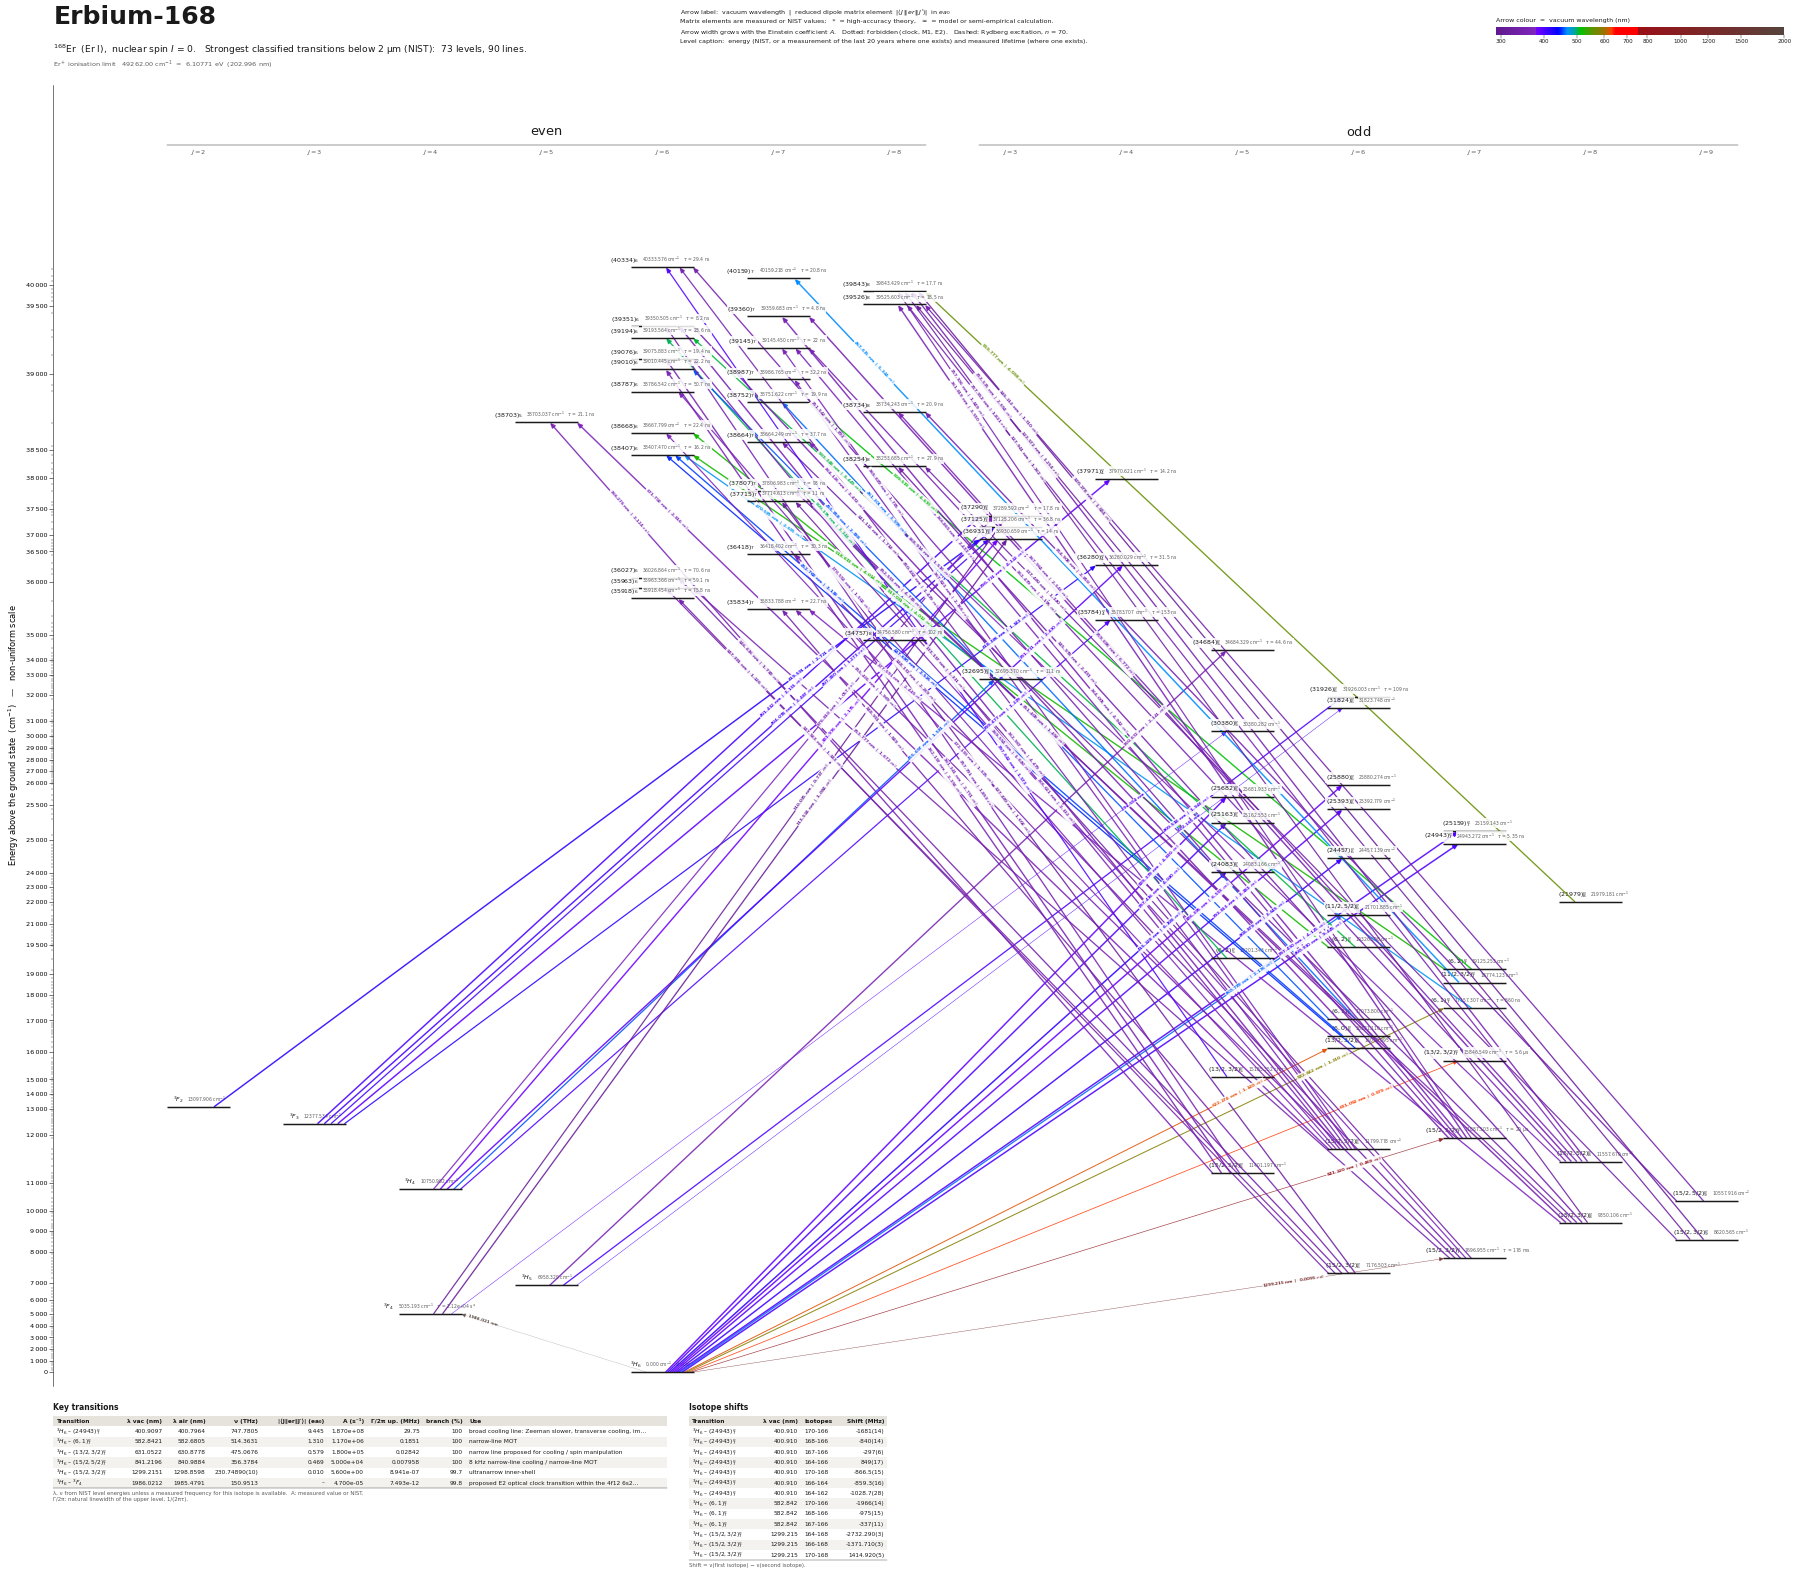 Erbium-168 (168Er)73 levels, 90 transitions below 2 µm
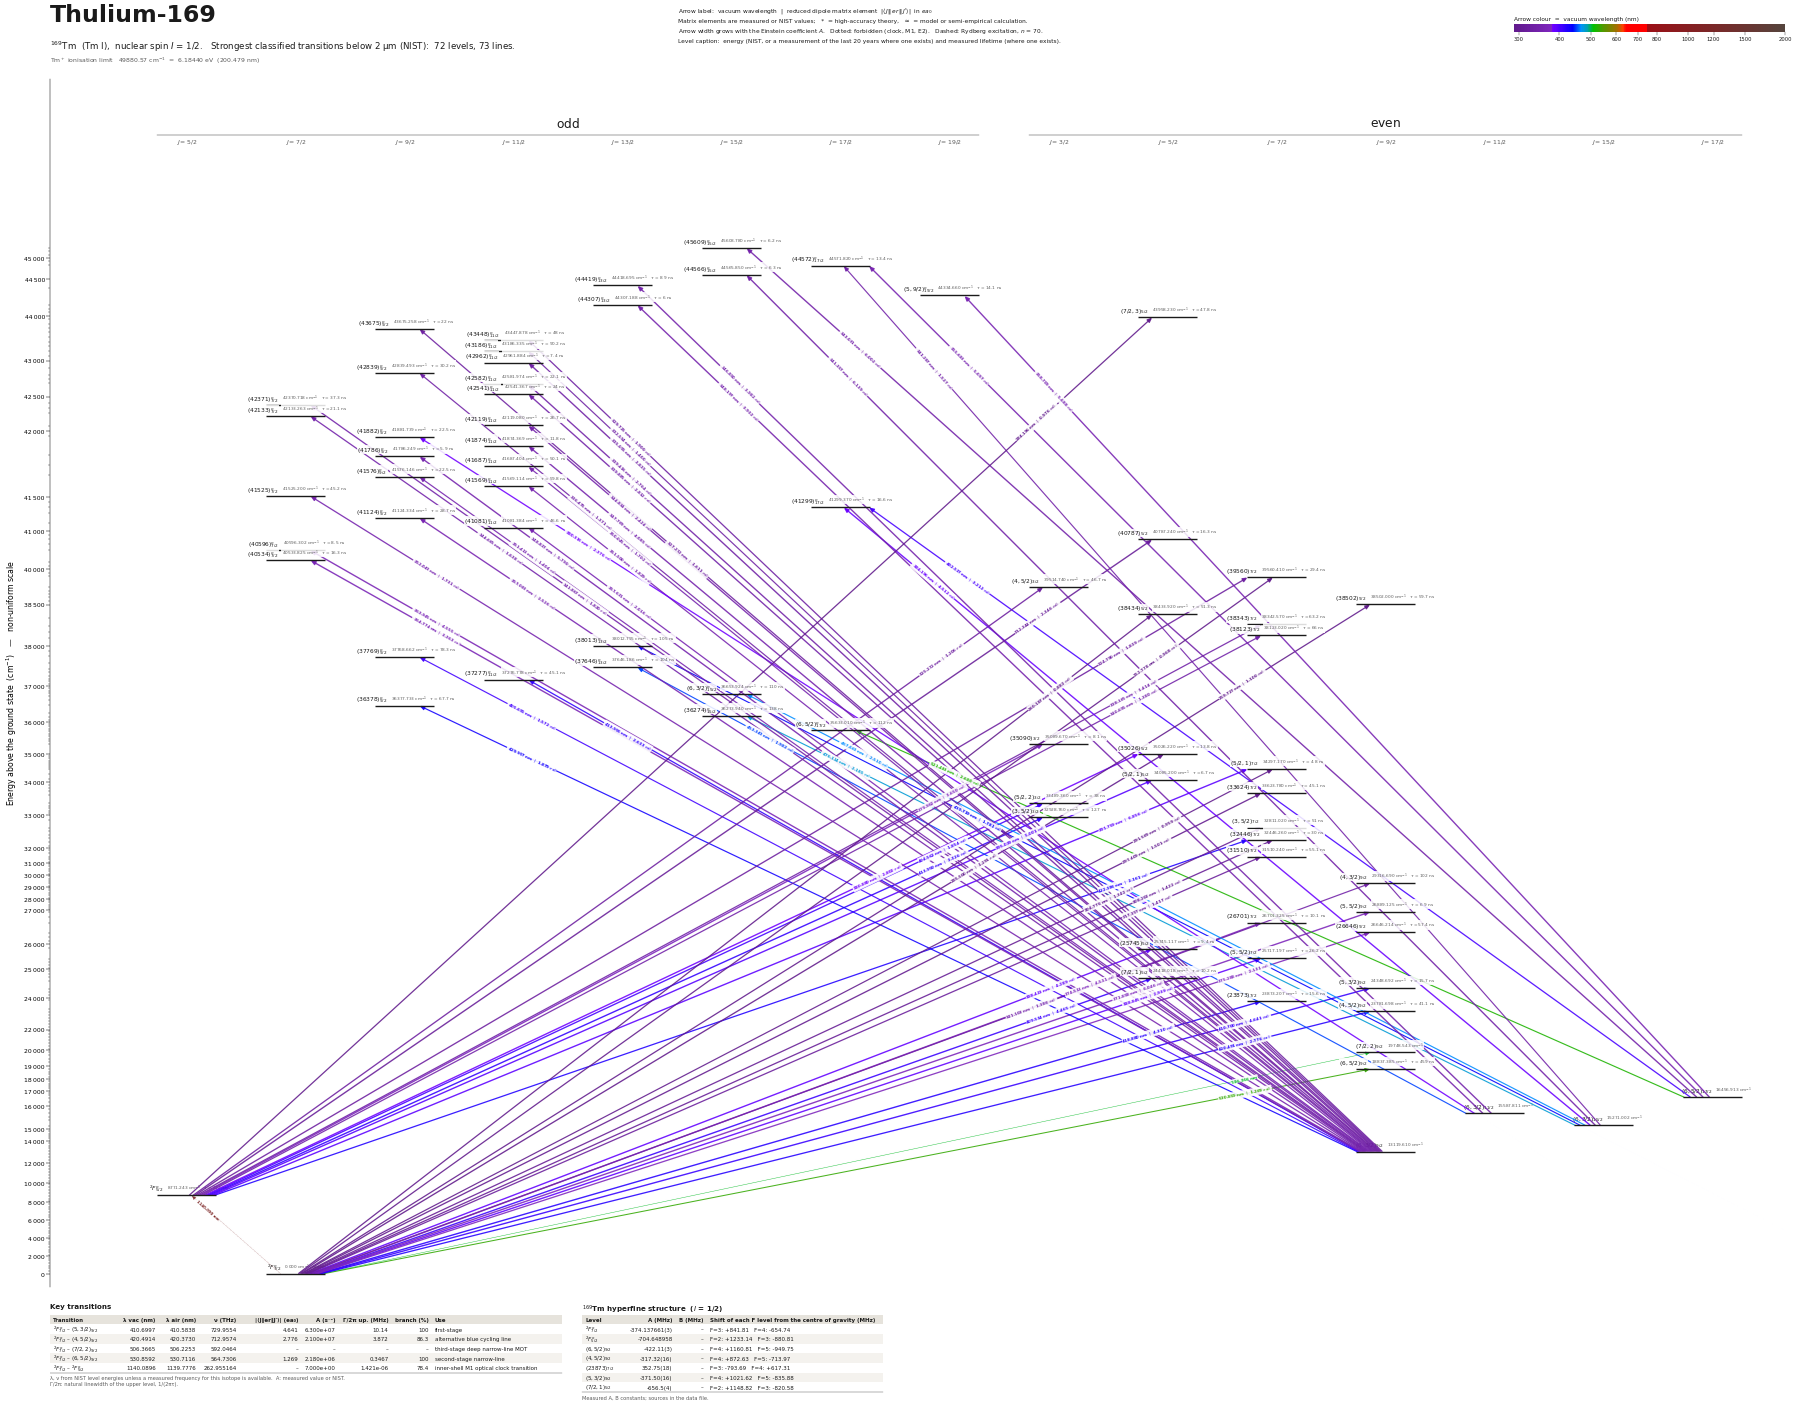 Thulium-169 (169Tm)72 levels, 73 transitions below 2 µm
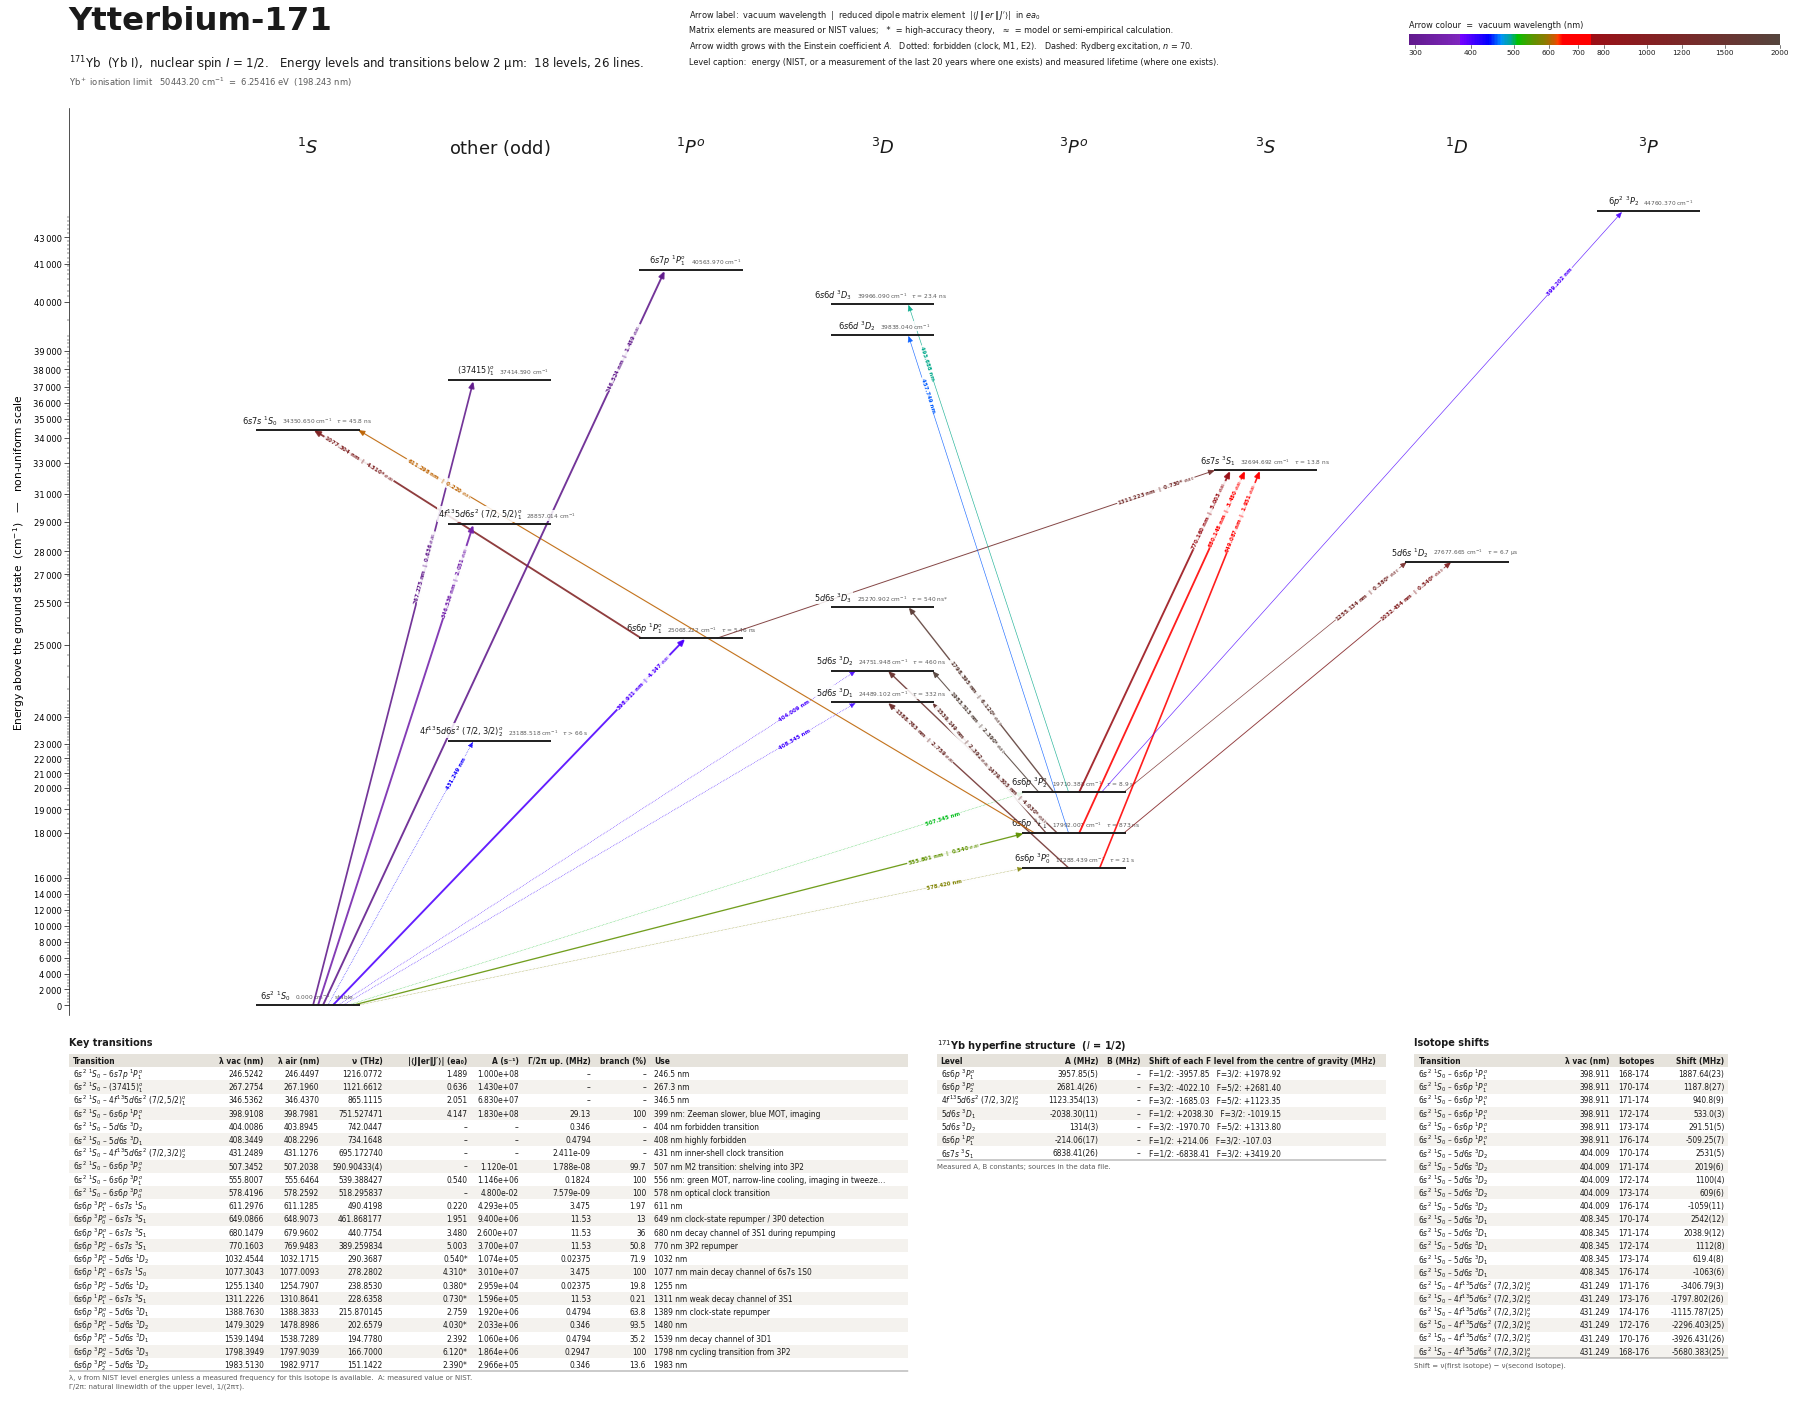 Ytterbium-171 (171Yb)18 levels, 26 transitions below 2 µm
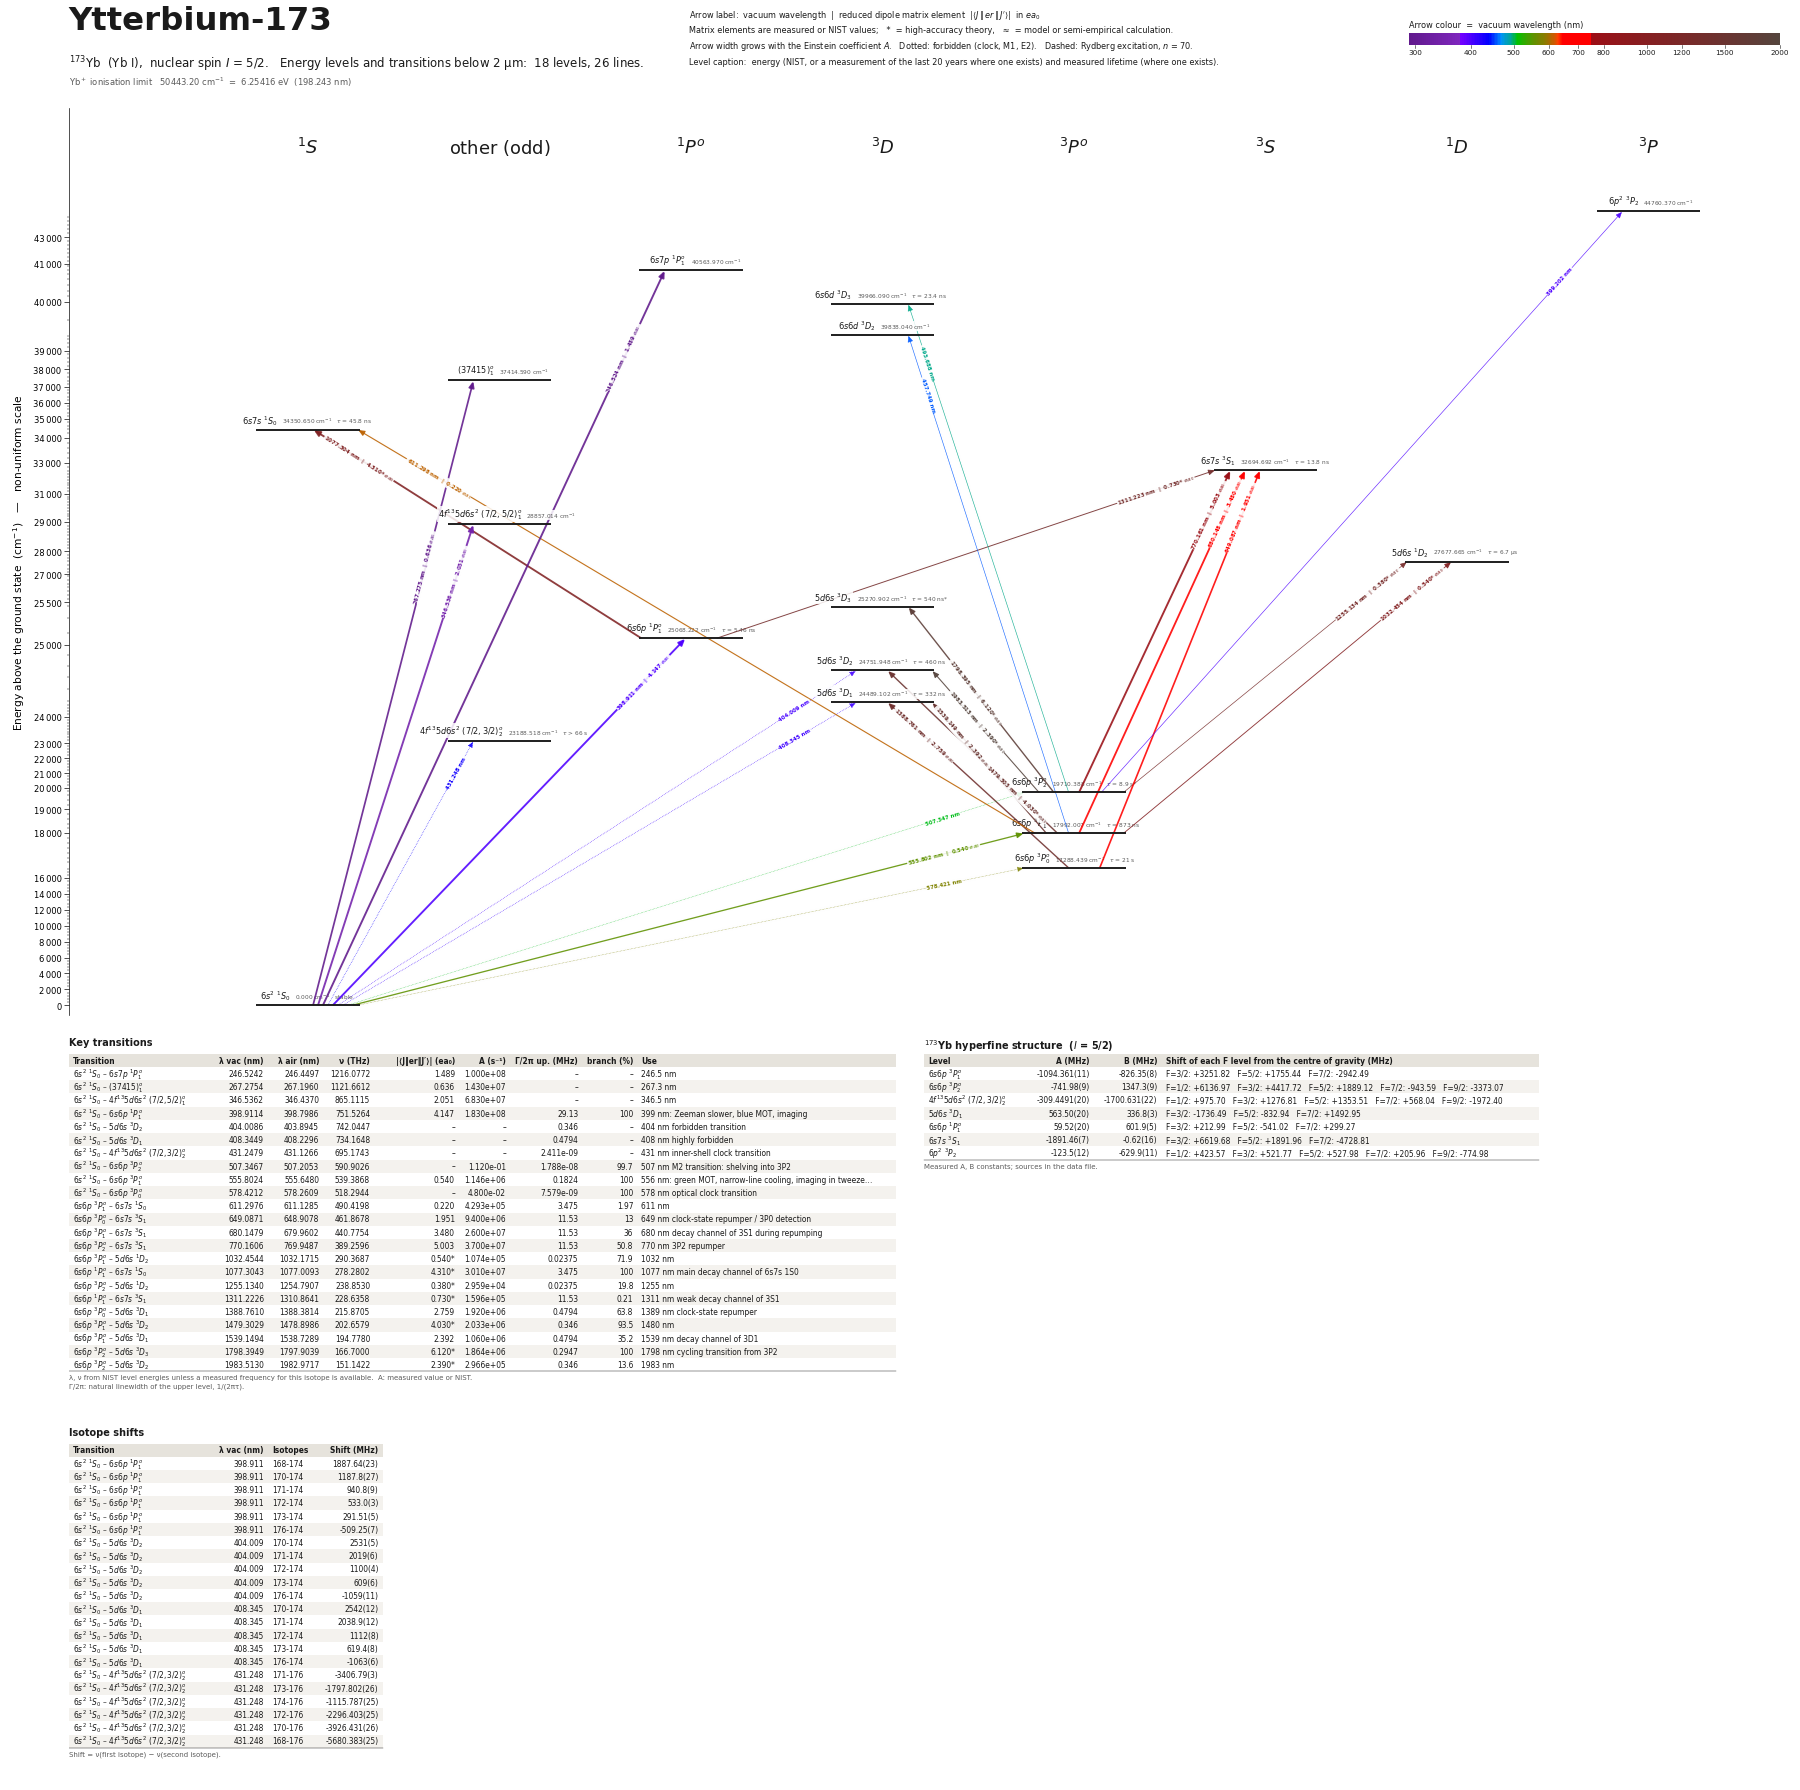 Ytterbium-173 (173Yb)18 levels, 26 transitions below 2 µm
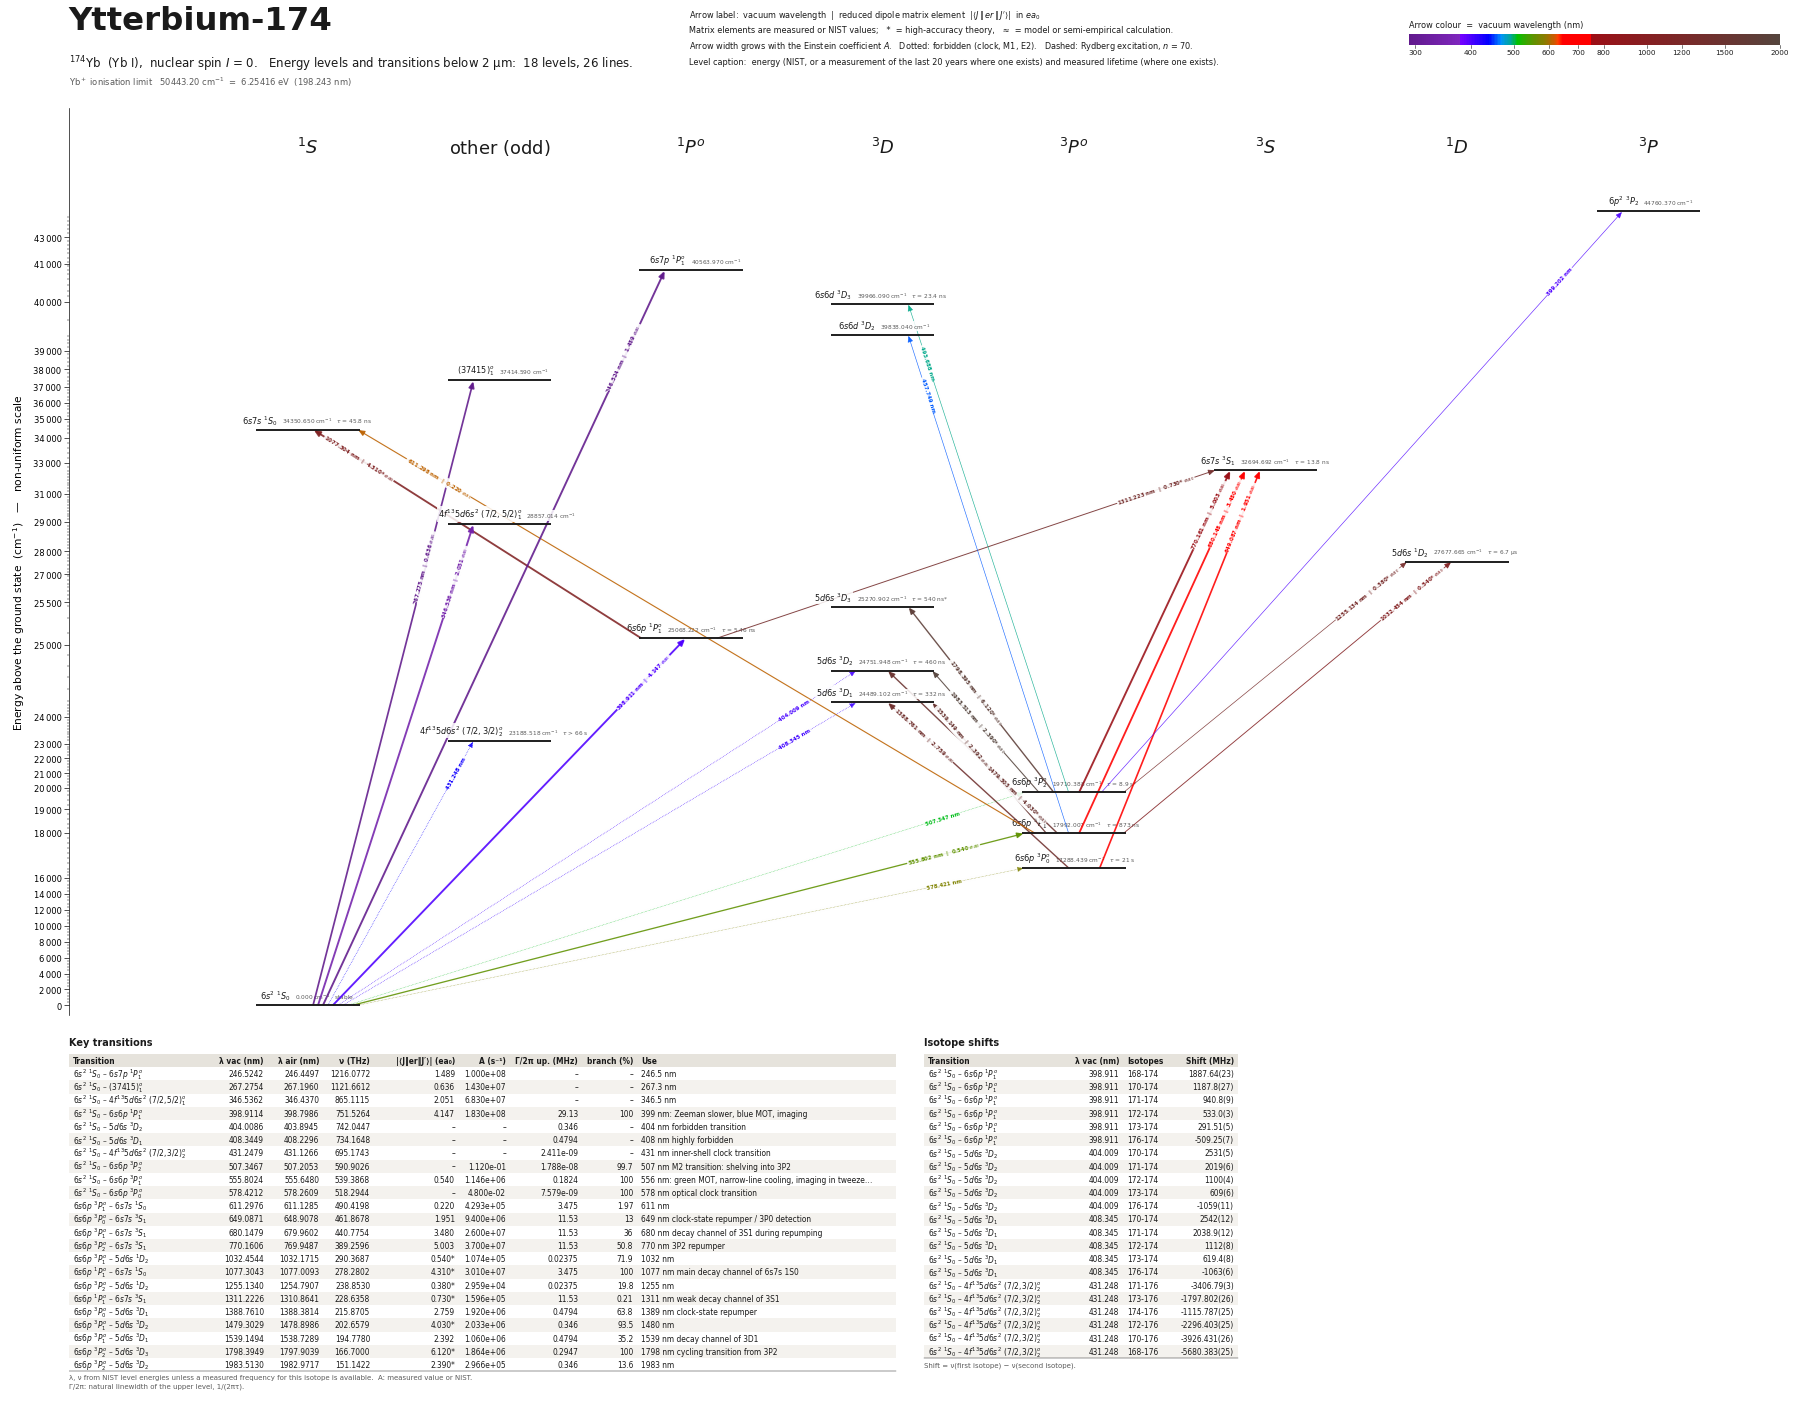 Ytterbium-174 (174Yb)18 levels, 26 transitions below 2 µm
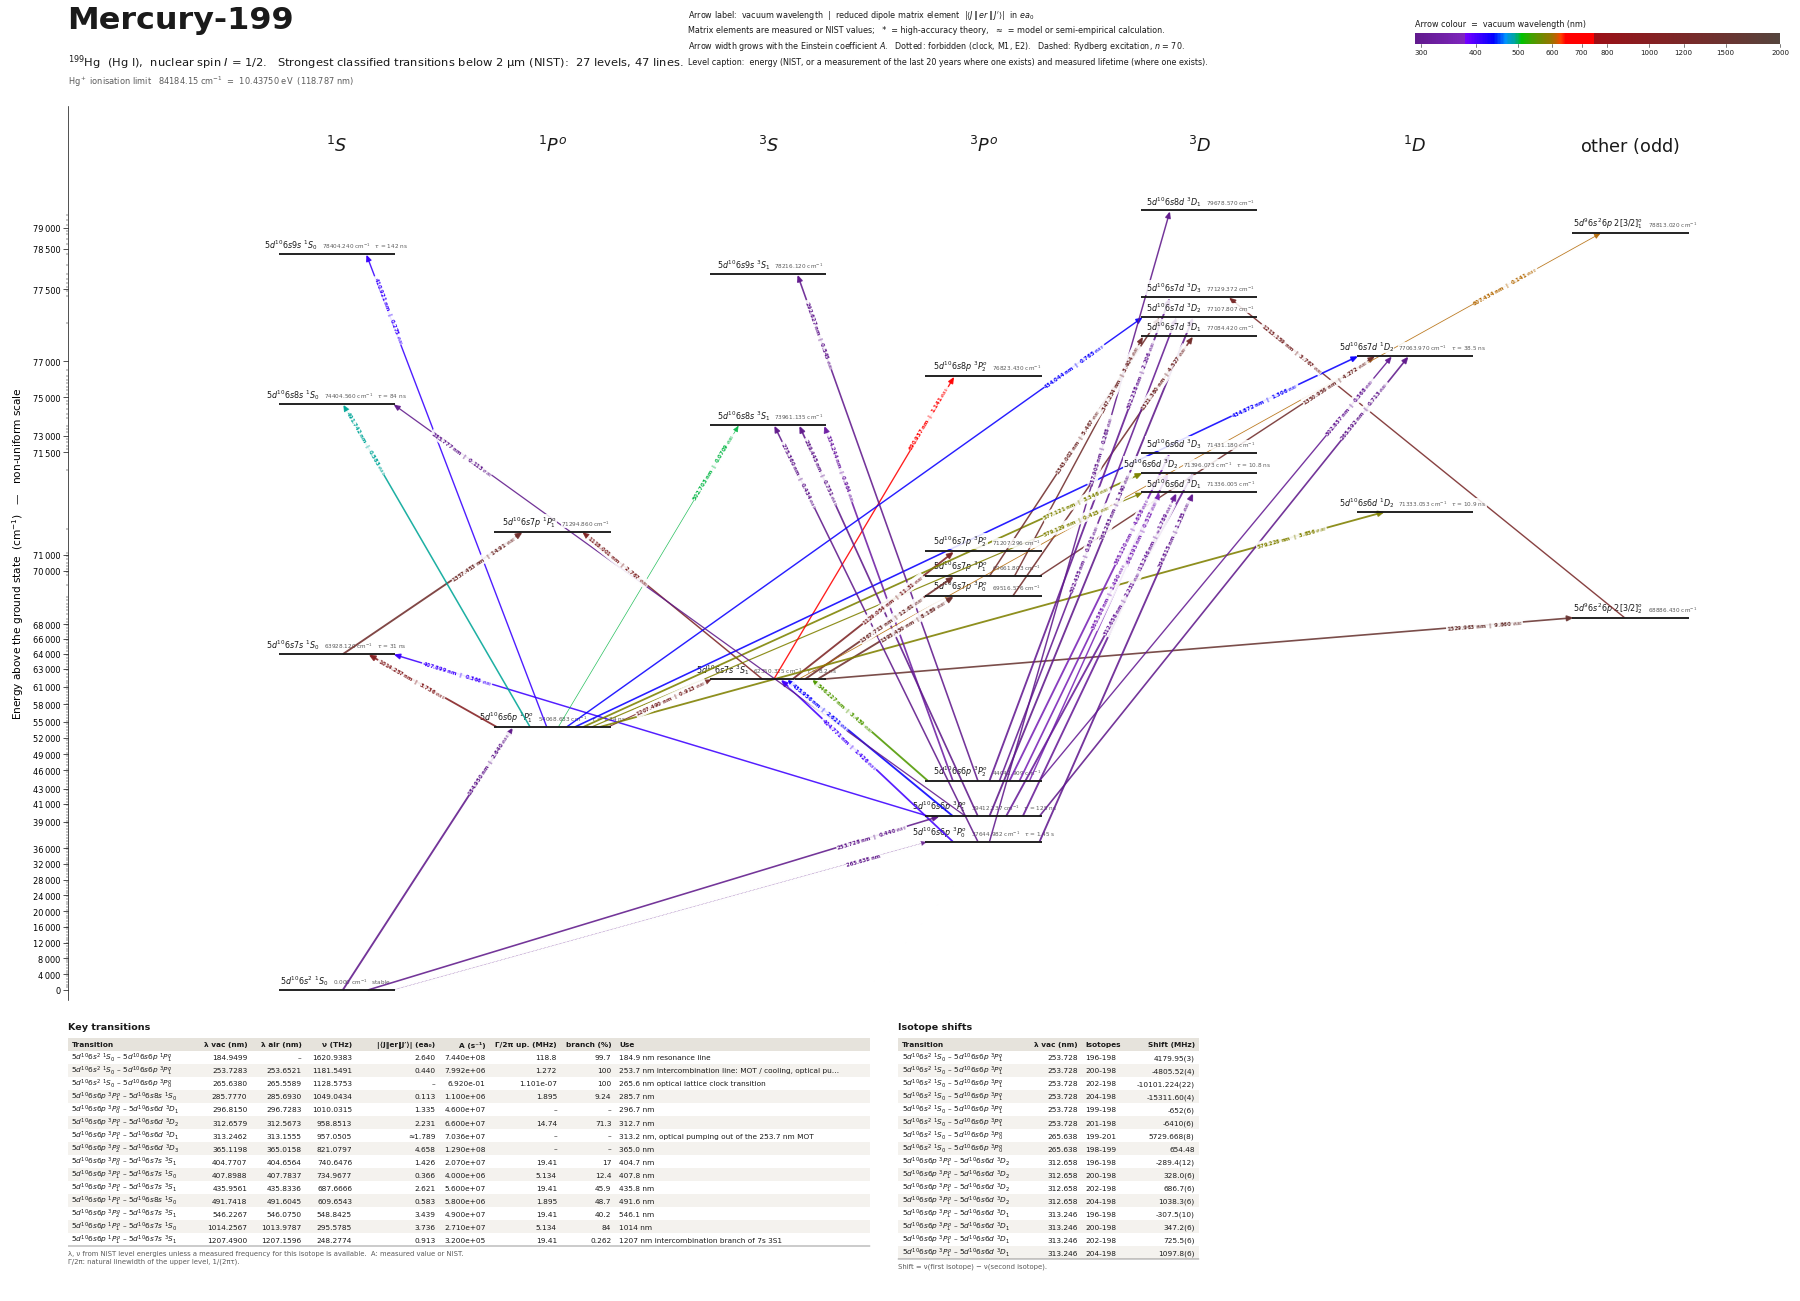 Mercury-199 (199Hg)27 levels, 47 transitions below 2 µm
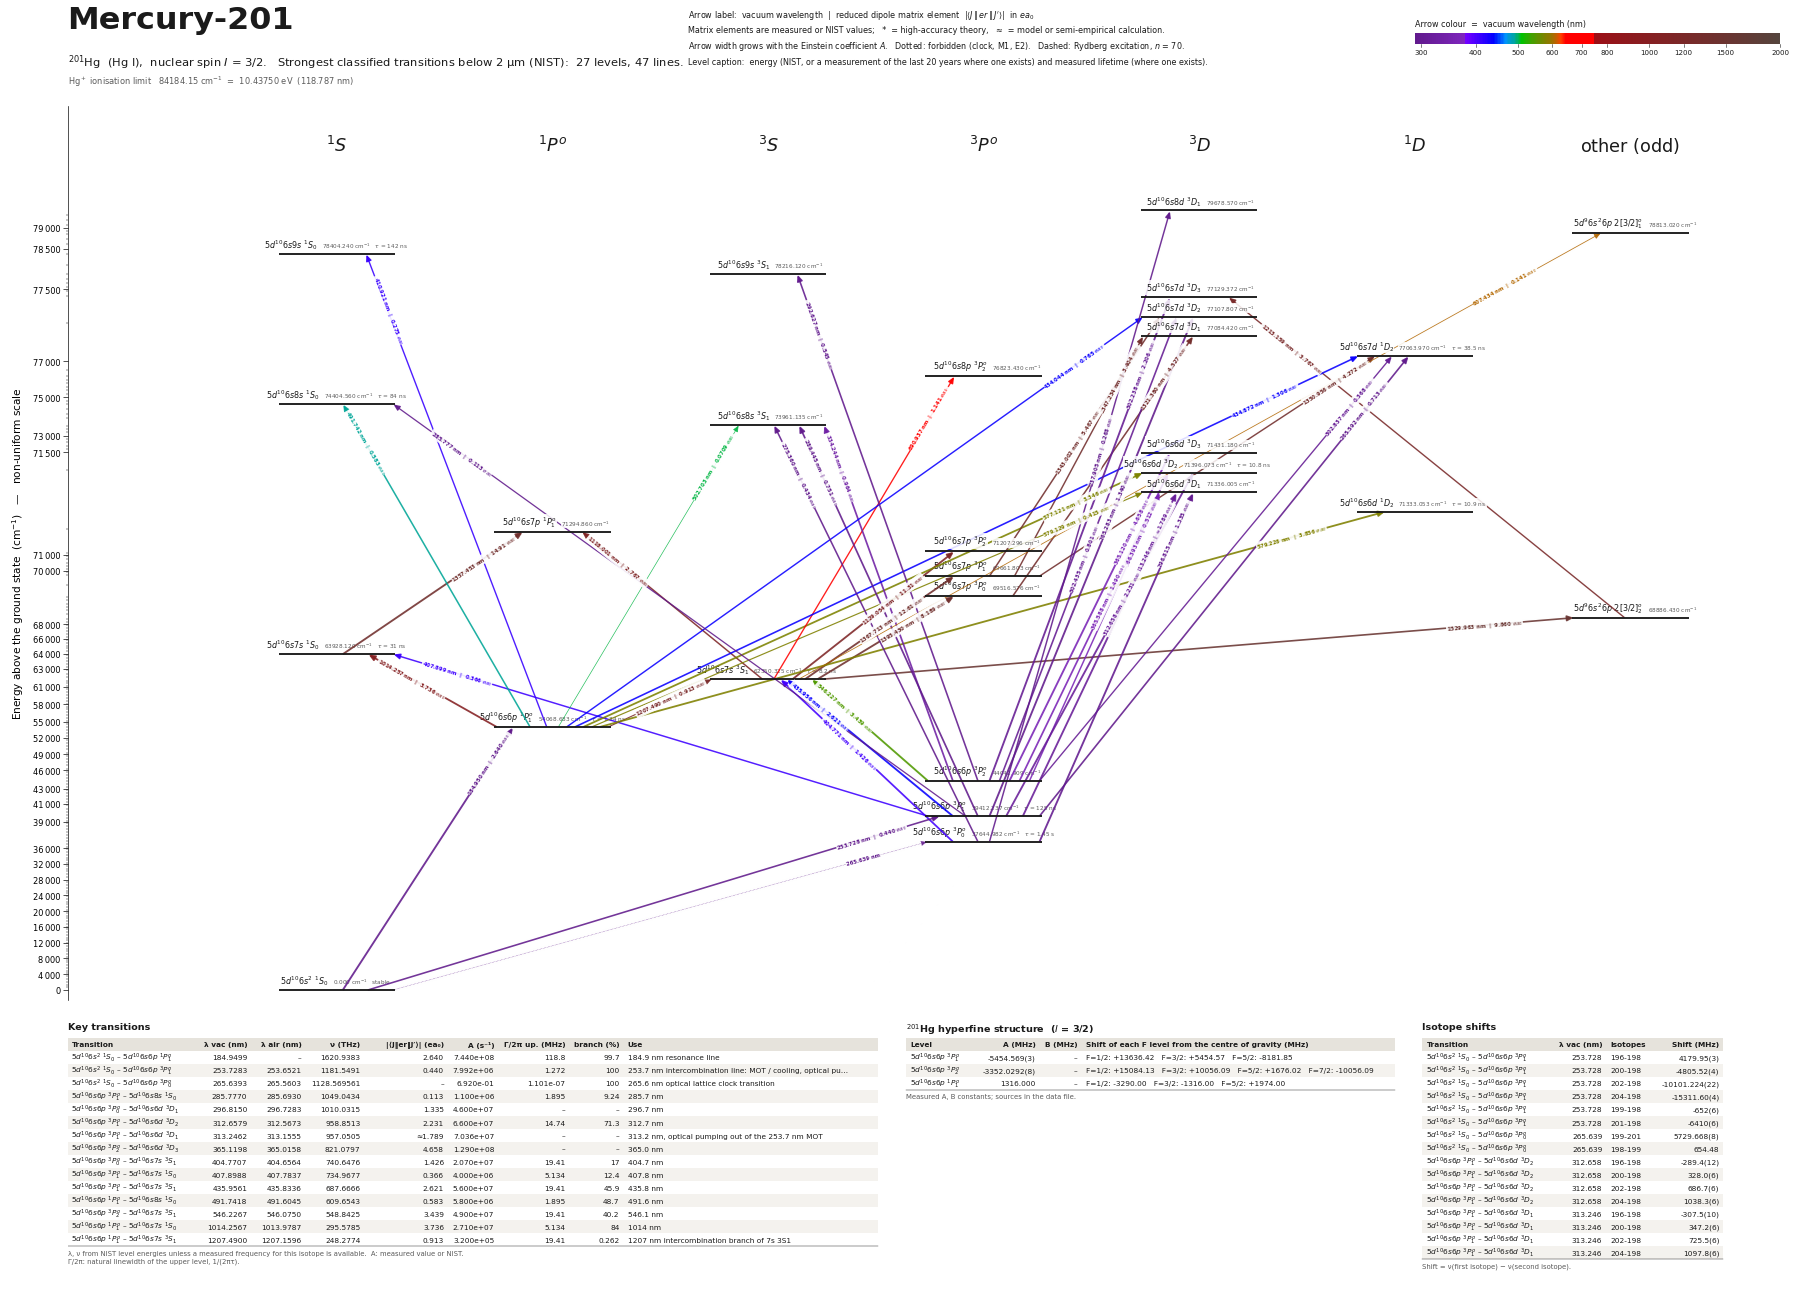 Mercury-201 (201Hg)27 levels, 47 transitions below 2 µm
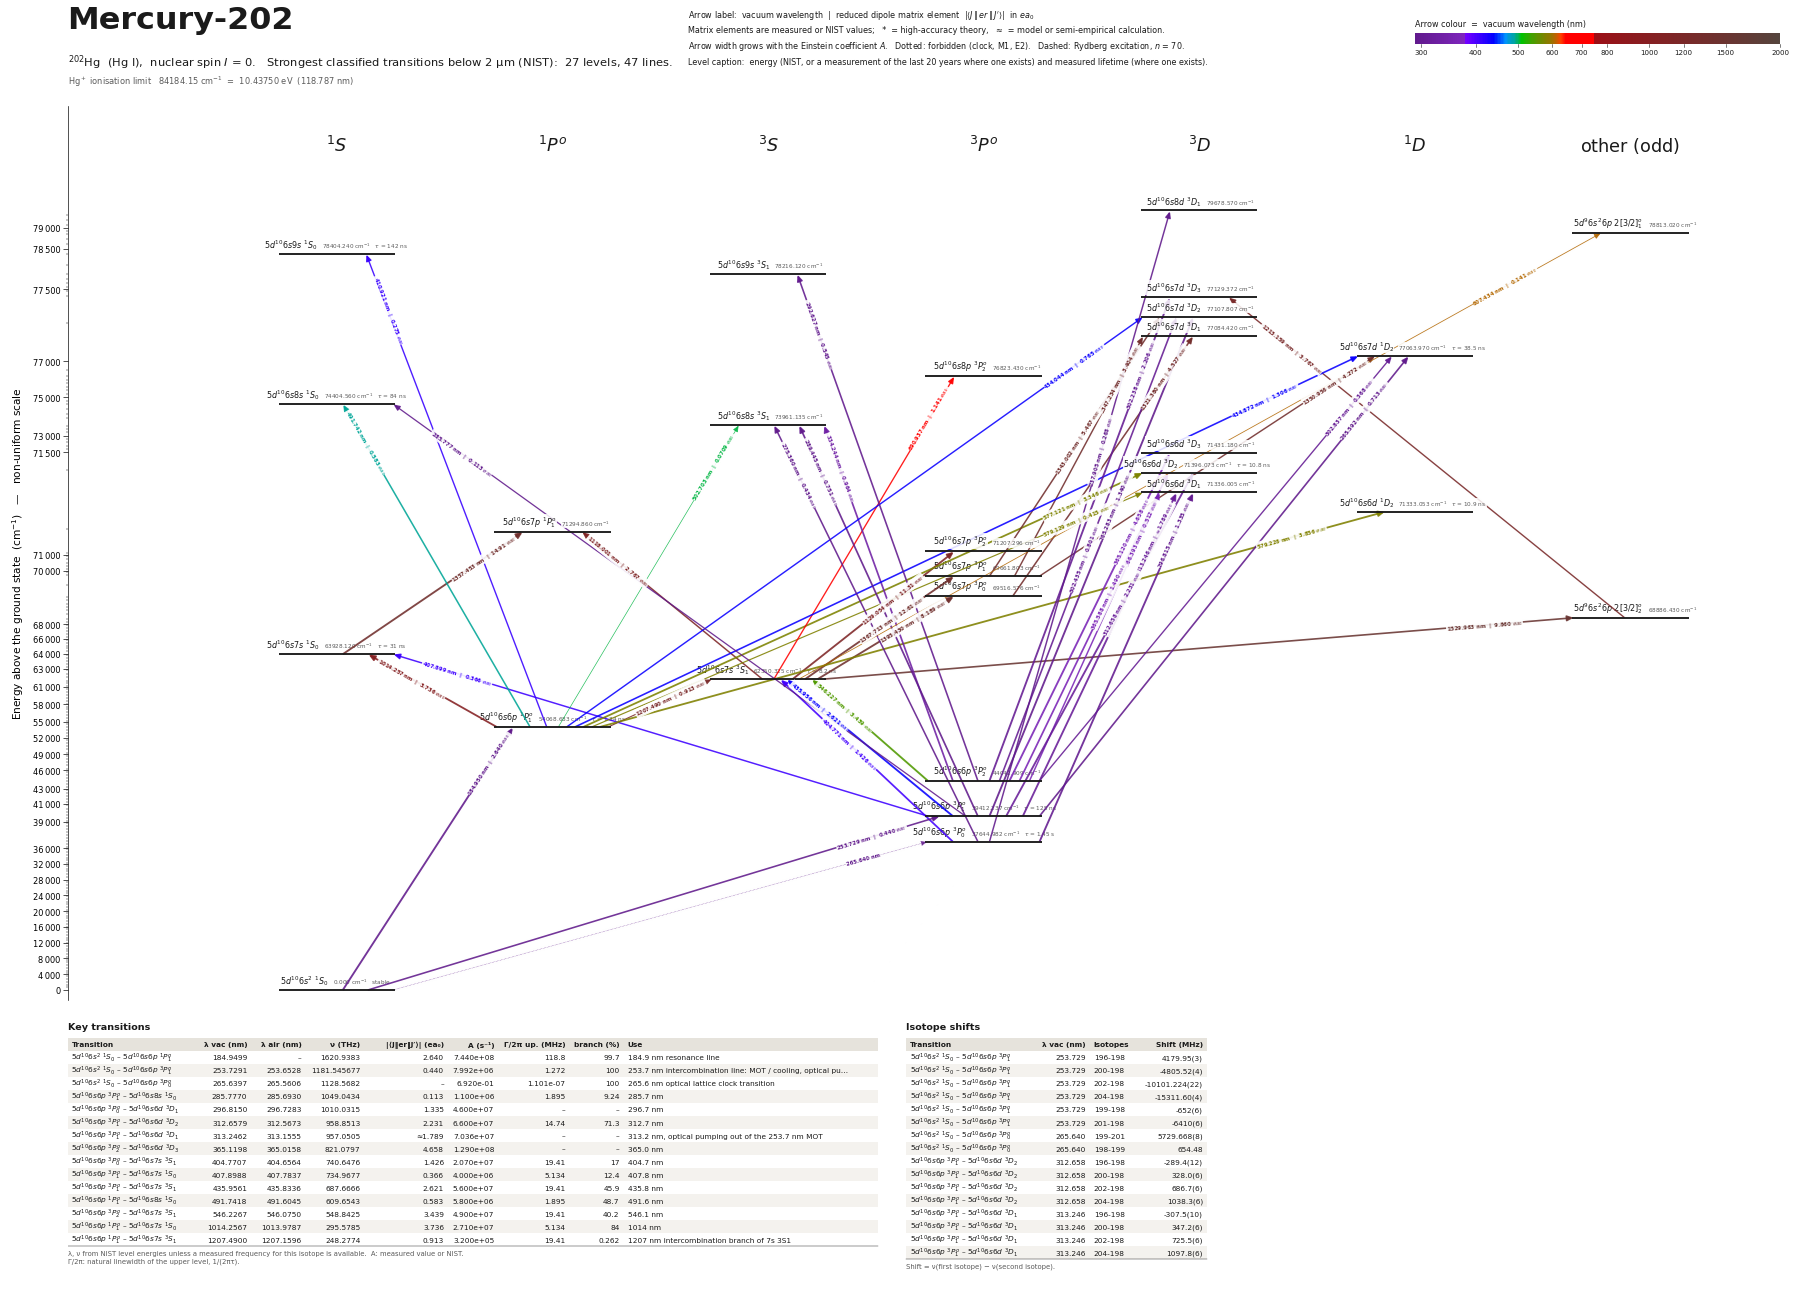 Mercury-202 (202Hg)27 levels, 47 transitions below 2 µm
What each page contains
A zoomable diagram (also as PDF and SVG), a table of the key or strongest transitions, the transition list with wavelengths in vacuum and air, frequencies, dipole matrix elements and Einstein A coefficients, and the level energies. Level energies and most transition rates come from the NIST Atomic Spectra Database; for the actinides from protactinium onwards, where NIST lists only the ground level, they come from the literature cited on the page. For mendelevium, lawrencium and the elements from rutherfordium on, no excited level has ever been measured: their cells (dashed) open a short page with the ground state, the ionisation energy and calculated lines, marked as theory. All tables are downloadable as CSV from the GitHub repository.